Risk Management - Case Study.
Table of Contents
- 1. Lecture 12
- 2. Context
- 3. Context Establishment
- 4. Risk Identification
- 5. Risk Analysis
- 6. Risk Evaluation
- 7. Risk Treatment
1. Lecture 12
- Class: Security Governance
- Topic: Risk Management
2. Context
The first step is to understand the environmnet to analyze, so the first thing to perform is an interview in which the analyst has to understend the envoronment and the context. In this example we are considering an application that interacts with the smart grid.
- The provider as to monitor how much energy is cunsumed by the customer to keep the balance of the load on the grid itself and to bill the consumed energy.
The important component to consider when discussing about smart grid, energy balance and energy savings are:
- all the system that are manging the data in the provider side
- the smart meters at the customer side.
A smart meter takes additional measurment over the consumption of the energy and it is able to send those information to the provider and act on the environmnet to manage the intensity of the energy provided.
The smart grid is a Cyber physical systems, and a critical infrastructure, so ensuring the security of it is fundamental.
Our aim is trying to evaluate the cyber risk that we need to face inside the smart grid; the services to protect are switching components that manage the power of a customer. We need to consider everything that is installed customer side, but perform the risk assesment for the Distribution Operator.
We have to follow the Cyber-Risk Management steps:
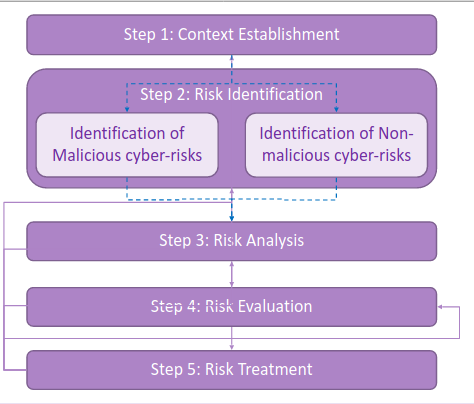
3. Context Establishment
3.1. Context Identification and Description
In this step is foundamental the interaction with the customer that is the expert of the domain. We have to ask questions to the customer to know which are the laws currently applicable. Conserning the external context, given the fact that the smart grid is part of a critical infrastructure it is subject to a number of national laws and regulations. For the assesor is foundamental to identify a document these laws and regulations; so a failure to comply may have significant legal and financials consequences. In estimating the impact is important to consider those consequences.
In europe they have to follow the NIS directive and in particular in italy the critcal infrastructure are part of the National Cybersecurity Border, so they have to follow additional rules.
Regarding the internal context, we have to understand the business aspects, how the system works and which are the components to protect and how to map them to the business part of the company. The first thing to consider is the mission of our customer.
The mission is composed of different subactivities:
- The service must be reliable. (availability)
- Exchange correct and timely information with the customer at all the times so that they can be charged the right amount.
- Protect the privacy of the customer.
An additional information provided is that internally most of the employees are technical skilled but few of the staff have received training in risk assesment.
3.2. Goals and Objectives of the Assesment
The customer is asking to: assess the risk with respect to the business continuity, so the capability to provide the right service to the customer, verify the law and regulation compliance, especially in the treatment phase, (some fixes may not be possible) and lastly improve the situation awareness to increase the overall level of awareness of the employees.
3.3. Target of the assesment
We have to map the technical part to the business aspect of the company.
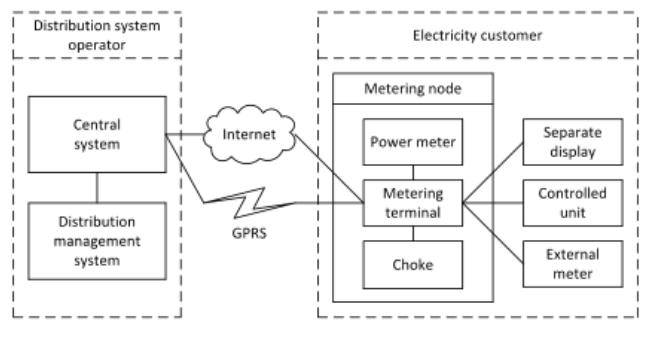
The system is composed by to parts, one running on the distributor side and another on the customer side. The two components exchange information using two communication methods: internet and GPRS for redundance reasons.
- Central System is the part of the system that exchange information.
- Distribution Management System is the part that manage the application logic of the infrastructure.
We need to identify which are the possible boundaries of the cyber space: what is installed locally plus what is installed on the operator side; the attacker could be in the internet, in the GPRS network and can try to attack from the distibution side or the customer side.
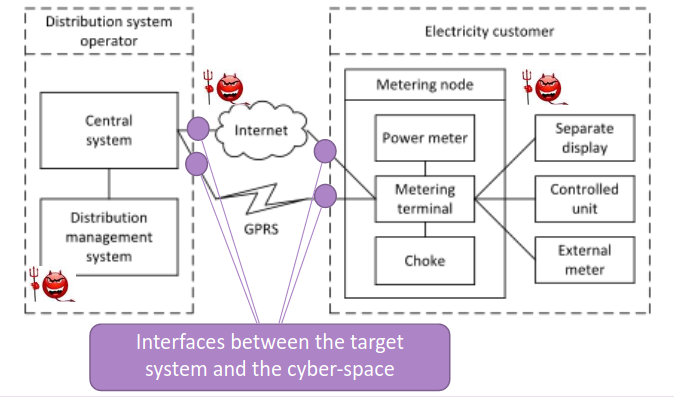
3.4. Scope of the assesment.
We have to scope the assesment and focus just on a particular part of the system, in these example we’ll focus just on the subset of the system that talks over the internet; and limit the attention only to the attacks that may comes from the internet without to consider the ones from the back-end side.
3.4.1. Focus of the assesment.
- Exchange of meter data via the internet is fundamental
- The main focus is not on the attacks that leverage on physical access to the components.
- Malicious and non-malicious threat sources must be considered.
- Focus on the AMU functions: register electricity customer metering data, transfer data between electricity customer and distribution system operator*, and switching on off of power provided to the customer.
3.4.2. Assumptions
- Threat sources could be internal or external
- Malicious and non-malicious threats may be both internal and external
- The target of assesment may be targeted not only by individuals with a purely financial or personal motivation but also by actors who whis to distrupt society.
- All meter data and constrol data sent between the central system and metering nodes are encrypted.
3.5. Assets identification
| Assets | Description |
|---|---|
| Integrity of meter data | The integirty of meter data should be protected all the way from power meter to distribution system operator. |
| Availability of meter data | Meter data form metering node should be available for distribution system operator at all the times |
| Provisioning of power to electricity customer | Power should only be switched off or choked as a result of a legitimate control signals from Central systems |
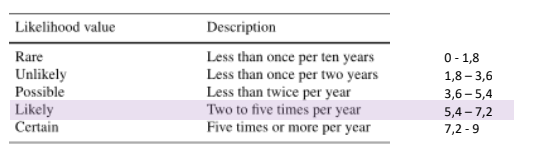
3.6. Likelihood Scale
The likelihood scale should allow the analyst to measure the probability of the occurence of the incident. We can decide to consider the frequency over a particular time window.
| Value | Description |
|---|---|
| Rare | Less than once per ten year |
| Unlikely | Less than once per two year |
| Possible | Less than twice per year |
| Likely | Two to five times per year |
| Certain | Five times or more per year |
We are using a quanlitative scale because we are consdering very huge time windows, and because it helps to mange a degree of uncertainty.
Of course the granularity of the chosen scale depends on the availability of data and the preferences of the decision makers.
3.7. Consequence Scale
This scale should measure how the incident will impact the assets, so it depends on the asset. A consequence scale for every asset must be defined.
3.7.1. Loss of integrity of metering data
| Value | Description |
|---|---|
| Insignificant | Errors in meter data for up to 100 customers |
| Minor | up to 2000 customers |
| Moderate | up to 20000 customers |
| Major | up to 50000 customers |
| Critical | mor ethan 50000 customers |
3.7.2. Loss of availability of metering data
| Value | Description |
|---|---|
| Insignigicant | |
| Minor | |
| Moderate | |
| Major | |
| Critical |
3.7.3. Loss of service provisioning
| Value | Description |
|---|---|
| Insignigicant | |
| Minor | |
| Moderate | |
| Major | |
| Critical |
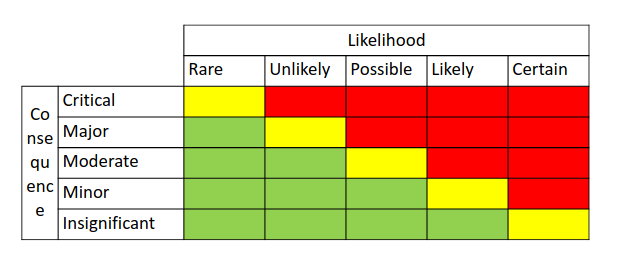
3.8. Risk Evaluation Criteria
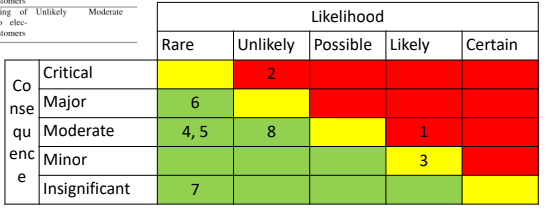
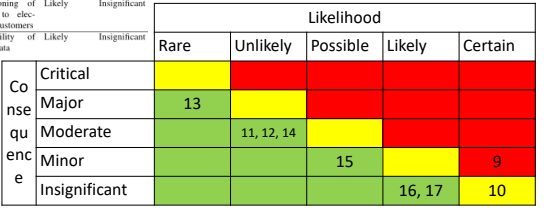
The last step of context establishment is to construct a risk matrix using the likelihood and consequence scale for each asset:
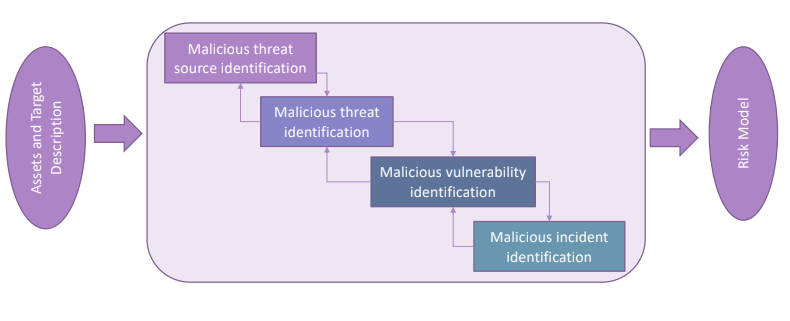
4. Risk Identification
The goal of the risk identification is to provide a collection of threat sources, threats, vulnerabilities, incidents and risks considering all the information provided by the customer and the assets considered in the previous stage.
There are different techniques that can be used to perform risk identification, first of all we should gather information about the environment, considering both quantity and quality of data.
The first type of information that we are going to ask to the customer are logs of the activities, communication and components, the components of the system itself like the protocols used and the resources used.
Other sources of information are vulnerability scans and results from pen testing or other kinds of security tests and source code reviews.
External sources must be considered like vulnerability and threat repositories; it can be useful also to consider information provided by people who know the target of the assesemt well from their paricular point of view.
NOTE. When using historical data do not fall into the trap of believing that tomorrow will be like yesterday. The fact that someting didn’t happened in the past does not mean that it will not happen. A
Once useful data are collect we have to refine the identification considering Malicious and non-malicious risks.
4.1. Malicous Cyber-Risk
First of all we have to understand who may want to initiate attacks and why; the potential for causing harm will depend on the motive and the intention of the threat sources, their capabilities and resources.
The first thing to do is to undestand who may want to create damage to the system, we need to consider the context that we are assessing and evaluate the possible motivations, their capabilities and their avaialable resources. It is fundamental to produce documentation for all of the aspects considered to use them to compute the likelihood of an incident.
4.1.1. Threat source identification
Create a table in which for each candidate threat source we cosnider theri motivation and capabilities:
| Source | Motive and Intention | Capability and resources |
|---|---|---|
| Script kiddie | He has no particular motivaiton except to prove his/her abilities. | Relatively unskilled, unable to perform complicated attacks. Very limited resources. |
| Cyber Terrorists | He wants to destroy a critical service to provide distruption in a society | May have significant resources and skll, could be supported by other nations or organizations. |
| Black Hat Hacker | They are motivated by personal gain, he tries to compromise the integrity and confidentiality of data. | The skill level can vary a lot, may be part of larger rganization and have a arge amount of resources. |
| Hacktivist | The attack could be a demostrative action, they simply want to prove that what the organization is doing is in their opinion wrong. | The resources and the sills can vary a lot. If well organized they can potentially have access to significant resources and competence |
| Insider | It is always worth considering its presence. The motivation is personal, like revenge or monetary. | May have access to all systems and posses detailed information and knowledge about the system architecture, functionality and security features. |
| Malware | Malicious piece of software that could enter inside the network by an accident and then cause harm to the system. | Malware can couse sigificant damages to off the shelf OSs and software |
4.1.2. Threat identification
After the threat source identification, for each of the source identified we have to consider the possible attack points and threats.
| Source | Attack Point | Threat |
|---|---|---|
| Script Kiddie | Internet Connection | DDoS attack |
| Cyber Terrorist | same as above | same as above |
| Cyber Terrorist | Internet connection between the central system and the metering terminal | tampering control commands data travelling betwenn client and provider |
| Black Hat | save as above | tampering metering data travelling between client and provider |
| Balck Hat | Communication between metering terminal and external terminal | Malware that manipulate meter data |
| Malware | Internet connection to the metering terminal | Metering node infected |
| Hacktivist | Tampering with control data for selected customers | |
| Insider | Central System Illegitimate control data sent to the choke components from the central system. |
4.1.3. Vulnerability Identification
We try to identify how the attacker could materialize the threat, the first thing to do is try to identify the vulnerabilities using documents, standards (ISO 27005), Online resources offered by OWASP or even try to use CWE repositories.
Starting from a low level analysis (scanners and other activities), correlate low level information to CWE and OWASP and then associate a specifi vulnerability to a specific threat.
| Threat | Vulnerability | Description |
|---|---|---|
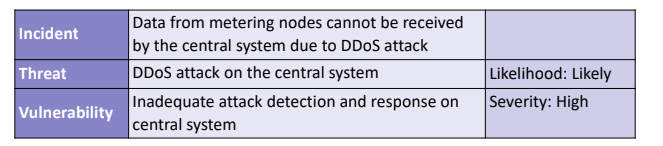
| DDoS on the system | Inadequate attack detection and response on the central system | |
| Tampering with control data in transite from the central system to the choke component | Weak encryption and integrity check | |
| Tampering with measuring data in transit from the metering terminal to the central system | Weak encryption and integrity check | |
4.1.4. Incident Identification
After that all the possible vulnerabilities are considering its possible to proceed to the incident identification, so how the specific threat will impact over an asset.
| Threat | Incident | Asset |
|---|---|---|
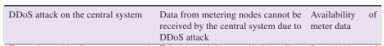
| DDoS | Data can’t be received by the central system | Availability of meter data |
| Tamepering of control data | Fasle control data received by the choke components | Provisioning of power to the customers |
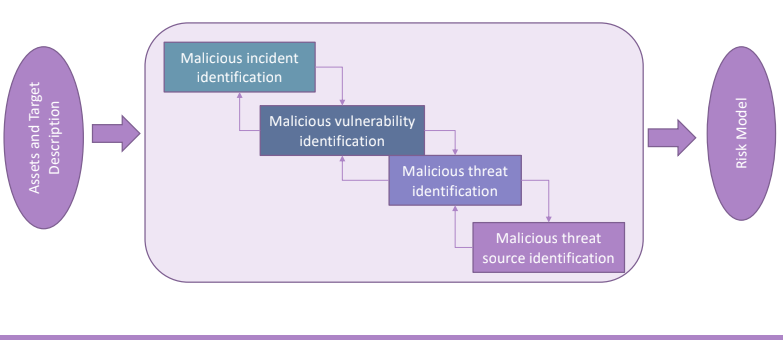
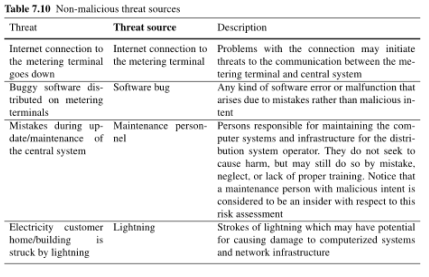
4.2. Non Malicious Threat source Identification
In this phase we’ll produce the same table but we’ll start from the incident identification.
5. Risk Analysis
In this phase we need to observe that the estimating could be decomposed in to the estimation of likelihood and consequences, so we’ll first estimate the likelihood and the the consequences. The information sources of this phase are the same of thos eused for tisk identification; the main difference is that now we need to consider the severity of vulneravilitiies, the likelihood of threats and incidents and the consequence of an incident.
The analysis can be decomposed in four questions:
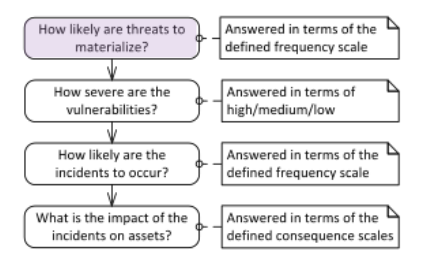
Once we have computed the likelihood we have to consider the consequence of each incident and then combine both elements inside the risk matrix. With regards to the malicious threat analysis we’ll use the OWASp methodology.
5.1. Malicious Threat Analysis.
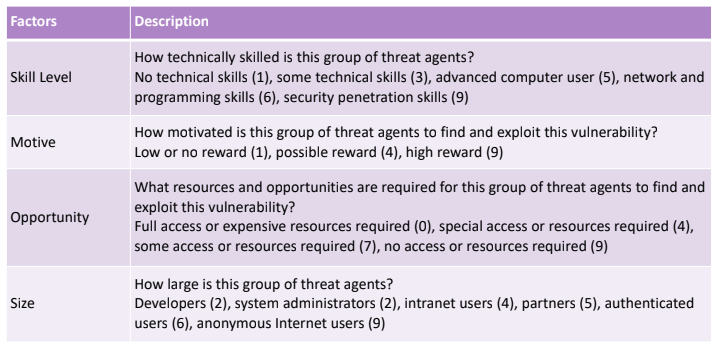
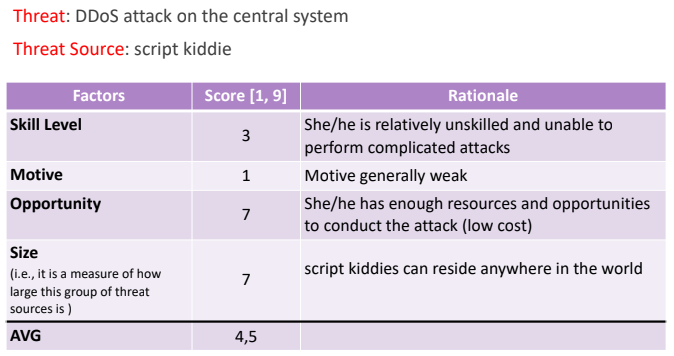
Given the table that relates threat sources to the threats we compute the OWASP score for each row, considering the Script Kiddie:
Considering the cyber terrorist that triest to perform a DDoS we’ll have a different OWASP table output:
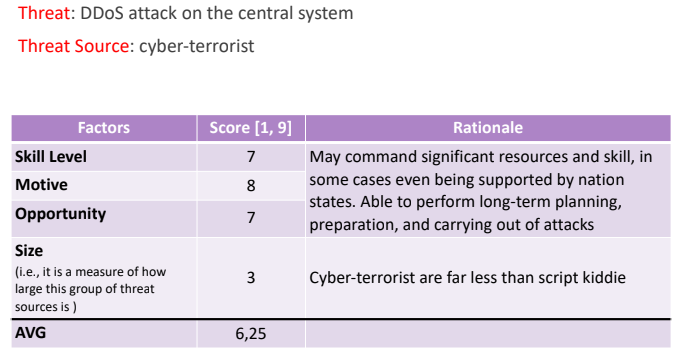
We need to map the numerical values over a qualitative scale of the likelihood:
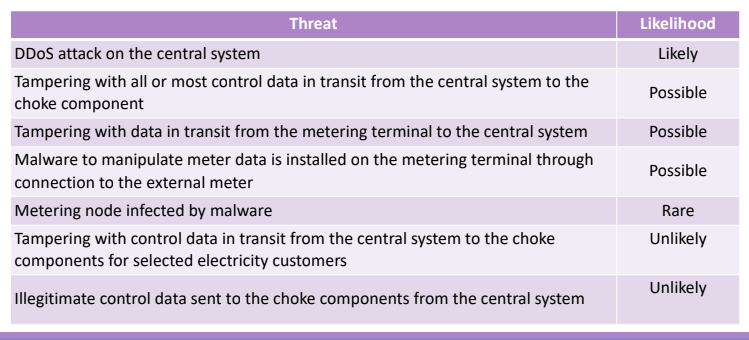
The numbers should be verified based on the logs and the data available, so we can adjust the numerical value considering historical data. At the end we’ll have the following table:
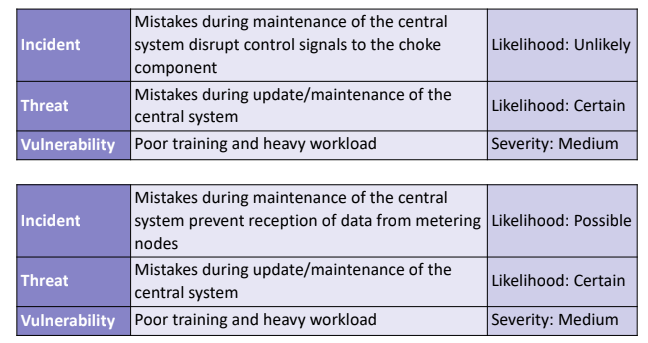
5.2. Non Malicious Threat Analysis
The same process must be done for the non-malicious case, in this case having no specific threat source we’ll note use OWASP (we cant score all the four attributes). The approach used will be based on the historical data, via interviews and experience. Considering this table:
we’ll compute the likelihood of each row.
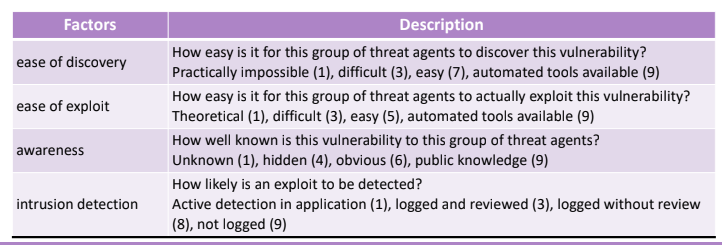
5.3. Vulnerability Analysis
We can use a simple scale composed by three interval to perform vulnerability analysis. The information sources can be experts of the domain, vulnerability scans, security testing, pen testing and code review. Using an inspired OWASP risk rating method:
5.4. Malicious Vulnerability Analysis
to analyze the following vulnerabilities:
- Inadequeate attacj detection and response
- Weak encyption and integrity check
- Unportected local network
- Outdated antiviruses
- Four-eyes principle not implemented, no logging actions of individual central system operator.
Considering (1):
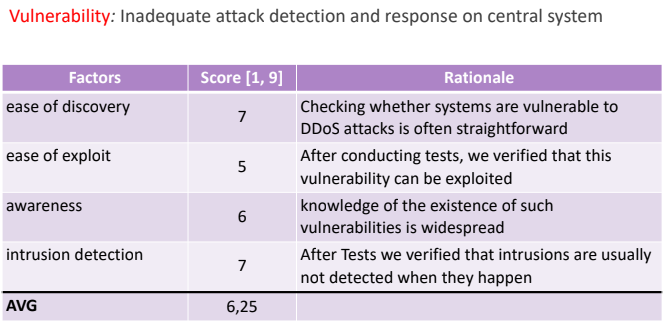
At the end we’ll obtain:
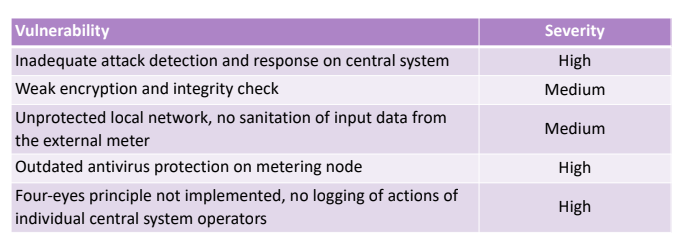
5.5. Non-Malicious Vulnerability Analisys
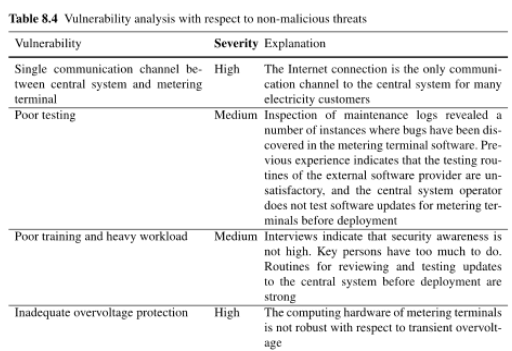
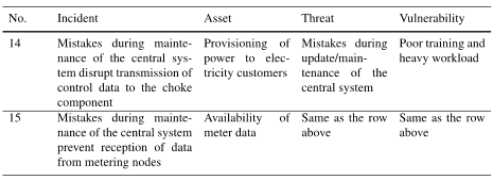
In this case the result of non malicious risk identification is used to identify different vulnerabilities. In the example we identifyied:
- Single communciation channel between central system and metering terminal
- Poor testing
- Poor training and heavy workload
- Inadequate overvoltage protection
In this case the assesment is done analysisng the environment and making consideration over the processes in place. For each vulnerability a rationale is presented togheter with the severity:
5.6. Likelihood of the Incidents
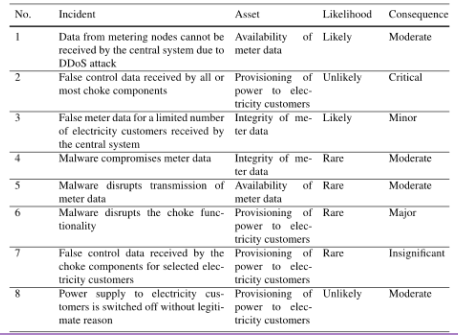
We’ll review one by one all the incidents taken from the table that relates the incident to the threat. For each row we’ll compile the following table:
Of course we can consider historical data, togheter with trend data, and adjust the value on the likelihood scale.
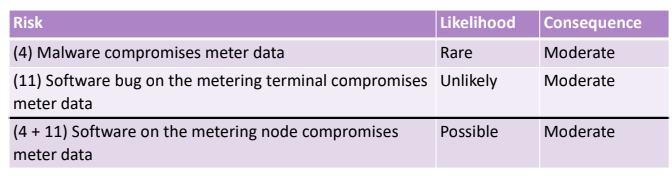
The same should be done for non malicious threats, for example, considering:
obtaining the table after some correction that are made considering historical data and similarities between the two incidents to produce a more precise output:
5.7. Estimate the Consequences
We must consider the consequence of an incident for each asset it harms, the consequence scale is tailored to each asset. Considering the first incident:
we review the historical data to produce a better output and then we score it. At the end we’ll produce something like this:
6. Risk Evaluation
The element produced by the third phase are then considered and plugged inside the risk matrix. The fourht phase is composed by four steps.
6.1. Consolidation
We need to ensure that the values associated to every risk are indeed correct. We will reconsider all the risks taking into account the possible uncertainties. The central question is not wheter each likelihood and consequence estimate is correct, but rather wheter the resulting risk level is correct. In some cases th euncertainty may change the evaluation of the risk:
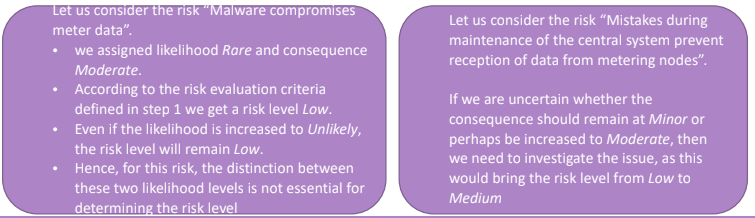
Another consideration may regards if there is any risk that is both malicious and non malicious, and if this relationship moves the risk inside the risk matrix. The last thing to do is to verify if both malicious and non-malicious threat sources where considered in the right way.
6.2. Risk Level
Malicious:
Non-Malicious:
For all the risks present in a border color zone we may need to revise them considering uncertainties. In the non-malicious case we assume that there is no particular bias and so we can proceed to the next phase.
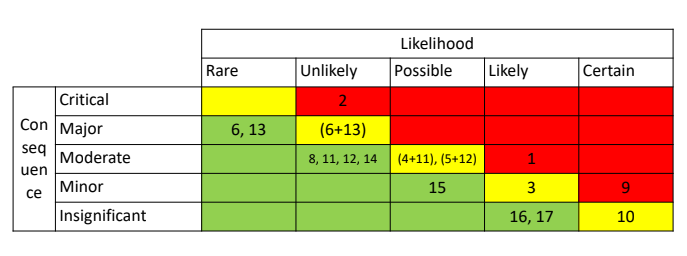
6.3. Aggregation
There are two kind of aggregation that we can perform:
- One incident creates damange to twp different assets. The same incident will create two times the problem of an incident that harms just a single asset. In this case the likelihood of the aggregated risk remains the smae but the impact of the incident will change, and is the joint impact of the two risks, the maximun of the two or the sum. Which function to use depends on the context considered.
- Two incident that impact the same asset. Two independent events may ahappen, if they happen togheter the impact could be huge. If the incidents are of the same time (generated by the same threat source) or if the occurrence of the two incidents are triggered by the same threat. This case is more difficoult to consider, because we have to uderstand how to change the likelihood and the impact. We need to look at the semantic of the incident and to the specific threat to produce data accordingly.
The same type of incident due two different threat sources (a malicious and a non malicious); so the risk can be generalised defining a more general case and adjusting the consiquence and the likelihood.
Similar consideration can be done for different risks, producing the following risk matrix:
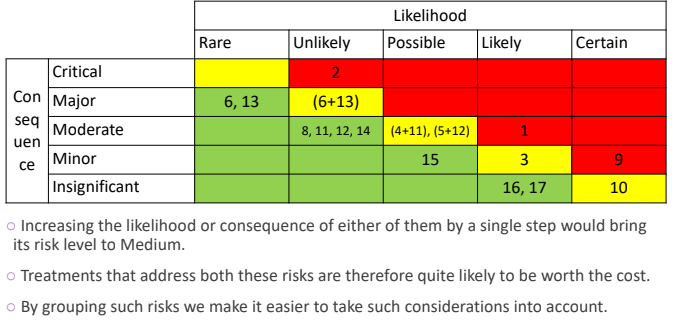
6.4. Grouping
In this phase we observe that several risks may benefint from the same treatment. For example:
If the vulnerability is resolved both of them could be resolved. The risk matrix will be adjusted in accordance to different considerations:
7. Risk Treatment
In this phase we’ll look for mitigation actions and a prioritization of those. We need to link possible mitigations to the speficic risks describing them via aspects that will help us to prioritize them.
For every risk a table that summerize its characteristics is produced and if a treatment is avaialable. There could be some risk without treatment, that can’t be managed directly (lowest priority), for all the others a further evaluation is needed.
7.1. Acceptance
The system remains in the system without doing anythign: tradeoff between mitigation cost and indirect cost of the incident. It is fundamental to identify the correct tradeoff. We can opt for a qualitative or a quantitative analysis. Given a risk and a treatment; then perform some considerations:
- The treatment can prevent the threat?
- The treatment makes possible early detection, thus reducing the likelihood of a full incident?
- In addition a fast response implies a reduction of the attack consequence.
A mitigation that moves a red risk to the green zone is worth considering from the benefit point of view, then we have to consider the cost dimension. For each risk we’ll produce a pair: benefit, cost.