Threat Modeling
Table of Contents
1. Lecture 13
- Class: Security Governance
- Topic: Threat Modeling
2. Introduction to threat modeling
Some techniques can be used to identify threats that can be helpful during the assessment process or at design time in case of a security by design approach. The technique is very general so it can be used at any phase, but it is commonly used after the design phase.
Threat modeling is a structured approach with the aim to identify, and address threats in a system. Most of the time is it used during the risk management process, but it could be used also to identify fixes to implement before putting the system in production (testing phase).
The main goals behind this approach are:
- Improve the security level.
- Improve preparedness. Start looking to the existing threats and put defenses around the most dangerous before a real risk assessment (proactive protection). Preparedness can be achieved via firewalls, IDS and similar tools.
- Increase situational awareness. It provides a snapshot of the whole situation of the organization, and knowing all the threats, their type and were they are is fundamental to enable the manager to reason in terms of business.
- Support risk management. Discovering threats for assessing their severity, and being able to assess the correlated risk.
2.1. Threat
A threat can be anything that represent a risk for an organization. Who could be the point or the actor that is going to generate that threat, the actor has a motivation and looks for vulnerabilities that can be exploited to materialize the threat. So the threat is the interception of different points of view.
Talking about threat is one of the main step to perform when dealing with risk, in the three factor model the threat is one of the variable to directly estimate to estimate the risk.
3. Threat Model
The threat model starts by focusing on four keys questions, it is fundamental to have clear what is the object that we want to analyze and the boundaries of the analysis; then we have to consider a scenario and understand what are the possible things that may possible go wrong (considering a network we can take into account damages to the CIA properties and the integrity of the network itself). The third thing to consider are the possible corrective actions and if the system needs a redesign or a patch is enough; at last we need to identify how much our analysis is covering the set of possible threats that exists inside the system.
None of the approaches developed until now guarantee perfect coverage, that is why this process must be done iteratively by different teams. The lack of complete knowledge of the system under analysis is the first source of bias when performing threat modeling (in an ideal case all the possible input are tested for all the possible execution path considering all the possible functionalities implemented by the system).
3.1. How to approach the problem
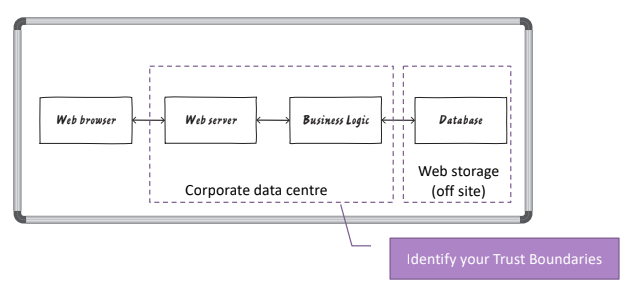
How can we understand how to design the system? The first thing to do is to brainstorm with the other members of the team to put together all the information that concerns the design of the system, this phase will result in the identification of the system’s components and the logical connections between them. For example a web application is composed by:
- a Web Browser
- a Web Server, where all the application logic is running
- a Business Logic, that represent all the logical functionalities of the system
- a Data Layer
We can start to identify how they are split, and where are the connections that links the inside part of the system with the external part of the system:
Once we have the design of the system we can proceed with the identification of all the things that do not work. One of the approach used for software systems is STRIDE by Microsoft (Acronym for Spoofing, Tampering, Repudiation, Information Disclosure, Denial of Service, and Elevation of privilege).
So considering the STRIDE components, we can start inspecting the system, considering first all the external blocks:
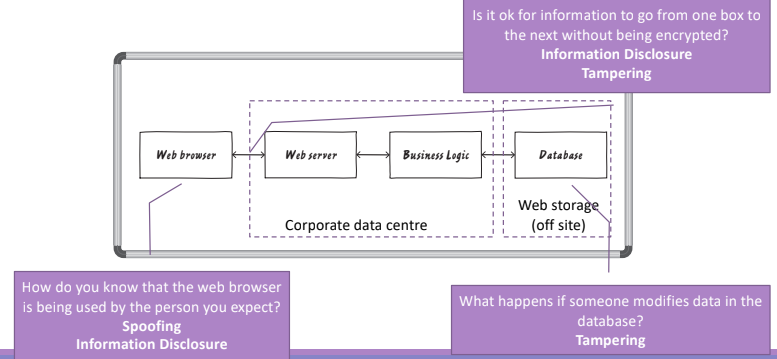
For example if the web browser part of the application does not implement any kind of authentication how can we be sure that the user behind the screen is the person that claims to be? At the boundaries between the database and the corporate data center we have to consider the possibility that someones modifies data in the database or during the data travel, and so on.
3.1.1. Tips
Unfortunately there is no algorithm that gives all the right answers, but there are some tips. The first one is to start from the external entities, iterating over all the components to identify all the six kinds of threats; the motivation behind this tips is represented by the fact that when we start from the outside we can easily identify domino effect caused by a threat. Of course this approach can be applied during design or when assessing an existing system. When using STRIDE can happen to identify a threat for accident, never ignore it, but put it inside of the threat set at the moment in which you feel that the threat exists; at the same time focus on feasible threats and do not try to image very catastrophic scenario that could happen with very low probability. Start from the threats that appears to be more feasible, then iteratively add less probable threats because the resources (cost and time) are not infinite.
3.2. Strategies of Threat Modeling
Talking about threat modeling there are three main strategies that can be applied: asset centric, in which all the analysis starts from the asset; attacker centric, where we start from the attacker perspective; software centric where we focus on how the software must be implemented and on the logical connections between software components.
3.2.1. Asset Centric Approach
We need first to identify the relevant assets, and then we should start to identify all the possible threats that could be generated over the considered asset. We repeat the these steps asset by asset.
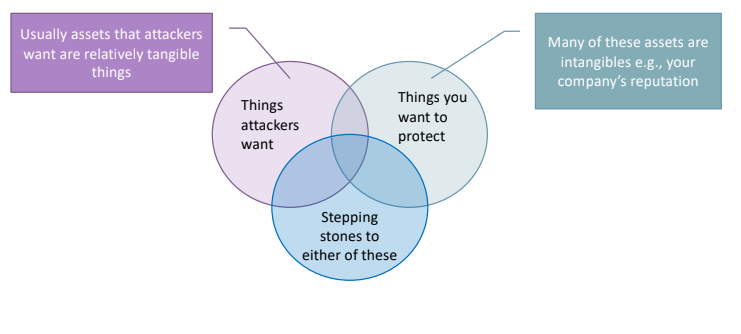
The difficult part of this approach is to identify what the target of the attack may be, most of the time the target is not something important for the company but it may generate a cascade effect that at the end will impact an important asset, also the asset may be intangible (reliability, good reputation, stock price, etc). This approach is used when the company has very clear the relation between intangible assets and tangible assets.
An asset centered approach can be implemented by following a list of steps:
- Make a list of assets, and then consider how an attacker could threaten each one.
- Starting from an abstract description of the asset, and then link it to a particular set of computer systems.
- Draw the system and think about how the attacker could interact with it.
STRIDE can be used after the identification of the High level objective and their connection with the Low level objectives.
3.2.2. Attacker Centric
In this approach We try first to identify the attacker and all the possible attacks that can be performed by him, at the end we try to link the considered attacks to the assets. The MITRE CAPEC repository can be used in this approach together with a proper brainstorm phase to link threats to the impact on the CIA properties. This approach can also bring up possibilities that are human-centered.
3.2.3. Software Centric
In the ideal world we have that the a software components implements exactly the requirements specified by the user.
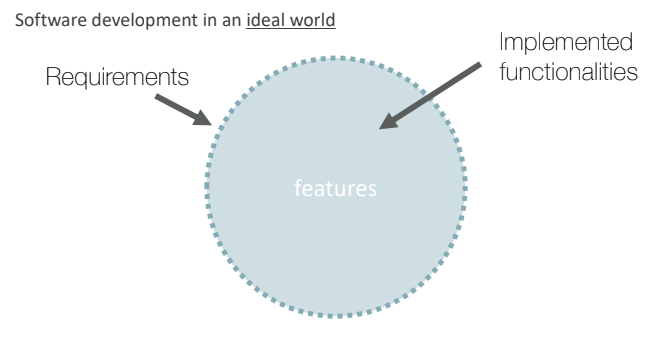
In the real world, however, the implementation does not cover exactly what the user requires, also there are some bugs (functionalities not implemented or not well implemented) and there is a set of functionalities that are implemented but that are not part of the requirements.
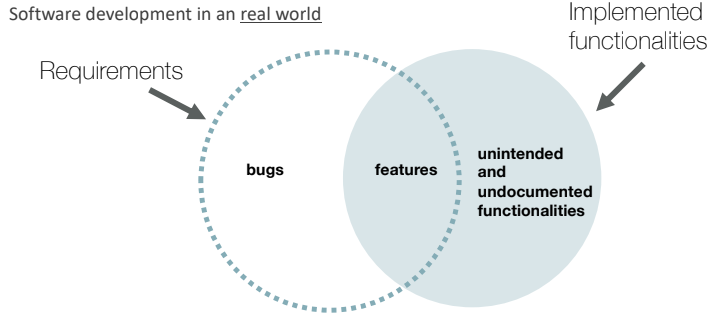
On the left side there are functionalities that introduce misbehavior inside the system, on the other side, functionalities that are not required most of the time are not documented and can be used by an attacker to leverage a possible execution path that generates a dangerous situation.
Currently ENISA is working on three certification schema for software: a general one, a 5G one, and a Cloud one. Given the fact that most of the services will run over 5G networks and will be offered as Cloud service, so on one side ENISA tries to give a base security level for software, and on the other side it will certify part of the infrastructure over which the application will run.
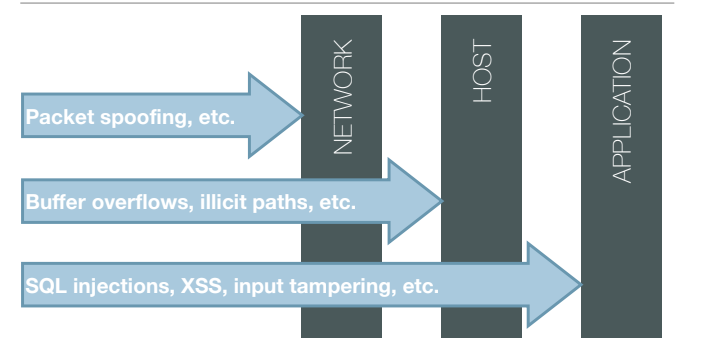
When we talk about software centric approach, we have to consider that there are several kinds of threats that can originate at different levels, not only at the application level:
During design phase is easy to fix all the possible problems that may be identified, the problem is that this process is commonly performed after the development is already started, or in the worst scenario, after that the product is complete. The idea is that if security principles are considered over all the software lifecycle the security of the software is guaranteed with a certain degree of security. On the other hand, later the security aspects are considered, higher will be the cost of securing the product.
3.2.3.1. Security actions
As we already know the software lifecycle is composed by different steps, at each one a particular set of action has to be performed to, at the end, produce the final product. At the same way at each step of the lifecycle some security actions may be considered, for example: during the Requirements and Analysis phase, developers focuses on how they can translate the requirements in software components; from the security point of view We must state which are the security objectives (functional and non functional).
In a similar fashion all the steps will have a related security action:
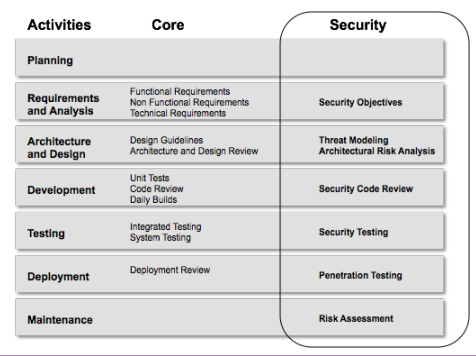
Acrhitectural Risk analysis consider the impact of the materialization of a given threat inside the considered system, and if the risk has to be accepted or has to be fixed.
During the development phase a code review is performed to assess if the way of the code is written follows the guidelines of secure coding.
In the testing phase security testing is performed, with the purpose of verifying that the security requirements stated at the beginning are implemented correctly by the developed software.
When the software is deployed inside the production environment, it has to behave as expected. From a security point of view penetration testing is performed to check if the production environment is safe.
Penetration test can be also performed in a cyber range. A Cyber range is an emulation platform that allows to recreate in a lab the same environment in which the software will be executed in production. These environments are used for testing and training purposes to guarantee a certain degree of security:
- To assess the security of the infrastructure itself, and
- to teach the personell on how to react in case of an incident.
Finally, during maintenance, the software is improved, and from a security perspective continuous risk assessment is done to ensure the level of security considering new vulnerabilities and threats.
Practically speaking this approach is not commonly used in its completeness, for example some security actions are skipped or performed at different phases.
3.2.3.2. Software Modeling
There are different ways to model a software system. We consider three modeling languages, in particular the Data Flow Diagram model that is suggests by the STRIDE approach by Microsoft.
Most of the time developers uses a flow chart diagram, but from the point of view of the Threat modeling purpose the flow diagrams does not capture the potential links between components and possible attack points.
- UML
UML is the de facto standard for the POO software system’s modeling, it can be used to describe functionalities, input and data of all the system, and like the DFD model it can be applied iteratively. The main difference between UML and DFD is that the latter is more general, so it can be used with every paradigm.
- Data Flow Diagram
A Data Flow Diagram is a graphical representation of the system, it tries to highlight the interaction between each component, it focuses on the data being exchanged, the components that exchange the data and how they do that. Also the model is hierarchical, so the threat analysis can be performed at different levels of granularity.
Iterative refinement can be used to proceed in a Top-Down fashion, to refine the threat analysis for each part of the system.
DFD is used to represent the main and relevant part of the system that will be implemented, it highlight:
- what data is input for the system,
- what data is produced as output, in particular storage components: so how the data will be stored and maintained, and
- processing steps
DFDs are useful to identify the trust boundaries of the system, providing an high level view of how the information system manages assets that need to be protected.
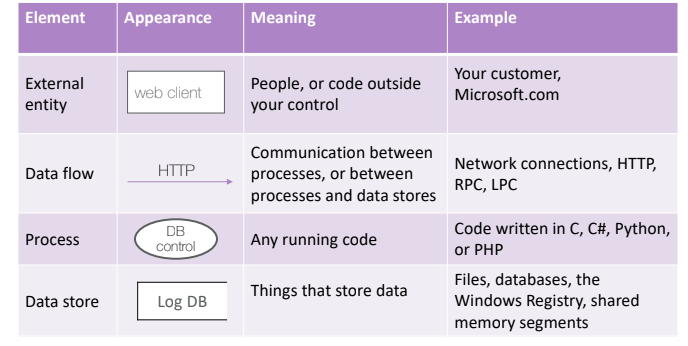
The external entity represent and external actor that is not under the system’s control. Conceptually is an UML actor. The data flow is represented with a direct arrow between a source and a destination; it represents the data movement, between system components; an example of data flow could be a HTTP request between to services. Process element can represent any functionality of the system, depending on the specific granularity this block can represent a whole system element, or a sub-element that support a specific part of business element: it could be a class, or it could be a single function, or maybe a whole service. The Data store represent an element that stores data, it could be anything like files, databases, shared memory or Windows Registry.
- External Entities
They could be an element that is physically placed many times inside the diagram, the same external entity could appear many times inside the diagram for readability purpose. Most of the time the external entity is not a direct part of the analysis, of course it may have an impact on the threat considered (for example spoofing, or man in the middle), so the implication of the presence of an external entity is considered, not the external entity itself.
Most of the time they represent a stakeholder that plays a relevant role in the design, but they are not our central focus. Typically when designing something as an external entity that element plays a role in the system but we have no direct control on it; at least for the scope of the analysis.
External Entities could also represent another software component or sub-system, and they must receive data or send data to the system being described. Sometimes they are used as a black box for other parts of the system that is covered by other analysis. When using these modeling elements there is a rule to follow: avoid to use data flows between two external entities (either they are irrelevant or one of the two must be analyzed)
- Data Flow
Data Flow elements always have a single direction, so a bidirectional communication must be represented by two different data flow elements; that’s because the two processes will have different goal in the communication, and so also the possible threat may be different. In this element we should represent only data, no physical movement of the elements, like an exchange of tokes or credentials. Also every arrow should be associated to a specific kind of information.
There could be fork in data flow elements, a fork is used to model a data flow between a single source to multiple destinations, or that the same data is requested by different clients.
- Process
A Process represent any element that does something in the system. In this case the general rule is that when a process is represented it should always have an arrow coming in and one coming out. Each process should represent only one function or action, typically process are associated to an action, so it is possible to reason over the verb that better represent the implemented function.
The DFD gives also the possibility to represent composite processes; they are represented with a double circle line, and a composite process is a process that does not perform an atomic action, and so it can be broke down in different sub-processes. An additional data flow diagram will describe in the details the aggregated process.
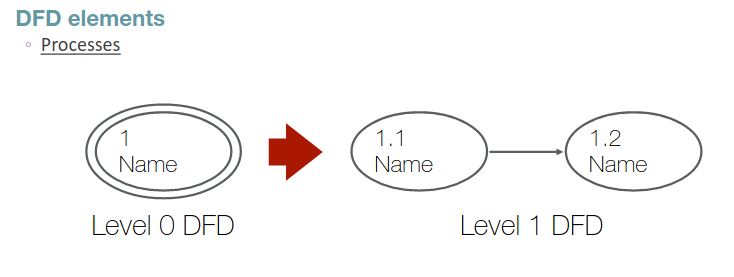
When making a specification step, the identification number of the processes must remain consistent.
- Data Store
A Data Store represent elements of the system that physically stores the data. Most of the time a label is used to indicate the data stored. The data stores can also be used as a connection point between different subsystems, the details about the data stored is not explicit, and it is described elsewhere in a data dictionary.
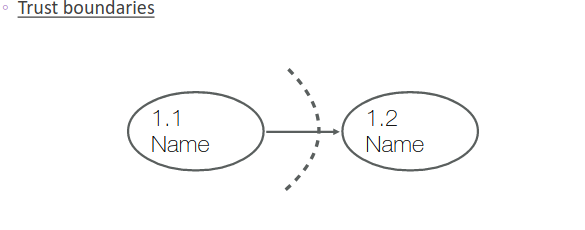
- Trust Boundaries
In order to define the trust boundaries, first we identify what’s inside and what’s outside of the system, and then separate them using a dotted line. Most of the time external entities are separated from the processes or data stores, but sometimes a trust boundary can be between processes to describe that just one of the two processes is inside a protected environment.
- Modeling of Data Flow Diagrams
The modeling of Data Flow is performed in steps:
- first we have to identify the actions and the actors together with the use cases.
- We build the context level DFD, separating external entities from the system. In this step we identify the main actors to be considered (and their inputs/outputs) fixing the interactions of the system. This diagram could be built directly from the uses cases.
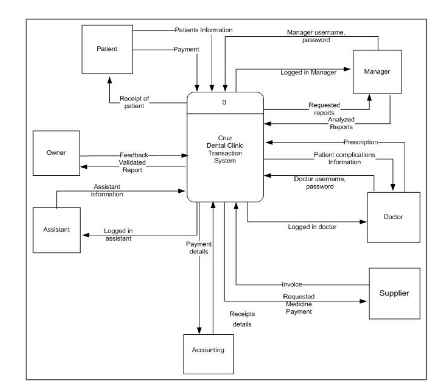
- Then we build level 0 DFD. The level 0 DFD breaks down the system, identifying the main business processes, and connect them with the appropriate data flows. It may include data stores at very high level of abstraction.
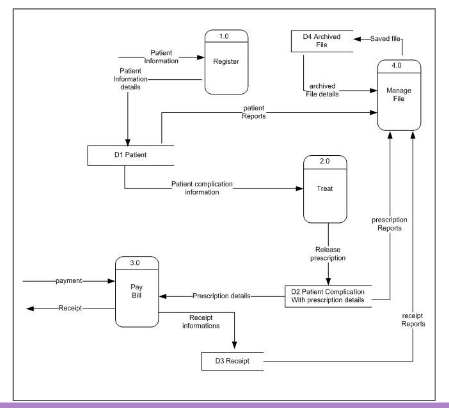
- break down level 0 DFD constructing the level 1 DFD identifying inter-process data flows, and data stores. In the lower levels DFDs a further specification of composite processes is done, it is an iterative process and the refinement should be done only to refine what needs to be refined. The balancing principle must be take into account: conserving inputs and outputs to a data flow process when that process is decomposed (maybe using forks).
- at last we add Trust Boundaries.
4. STRIDE
The STRIDE approach to threat modeling was invented in 1999 by Loren Kohnfelder and Praerit Garg. This approach falls in the category of Software-centric threat modeling. The STRIDE classification considers six kinds of threat: Spoofing, Tampering, Repudiation, Integrity, Denial of Service and Elevation of Privilege. It is a Threat elicitation technique, it provides no way to measure the coverage.
4.1. Spoofing
| Threat | Violated Property | Definition | Typical Victims | Examples |
|---|---|---|---|---|
| Spoofing | Authentication | Pretending to be something or someone other than yourself | Processes, external entities |
Every time the interaction between two processes or between a process and an entity is authenticated a spoofing attack could take place. The typical example of spoofing that can be considered in an analysis is the spoofing of a process on a machine. For example if a machine can be accessed by everyone, this threat is quite probable, because an attacker can materialize the threat in different ways:
- Renaming/Relinking
- Create a file before the real process
A second type of spoofing concern files, for example an attacker can create a file in the local directory and redirect a user to that file, or create a link and changes it (the link seems correct, but it redirects to a fake portal), creates many files in the expected directory that an application interpret as a real file.
4.2. Tampering
| Threat | Violated Property | Definition | Typical Victims | Examples |
|---|---|---|---|---|
| Tampering | Integrity | Unauthorized modification of data on disk, on a network, or in memory | Data stores, data flows, processes |
It deals with the unauthorized modification of data (that could be stored, in transit, or the software running in memory). Tampering can be performed on files, memory or a network.
4.3. Repudiation
| Threat | Violated Property | Definition | Typical Victims | Examples |
| Repudiation | Non-Repudiation | Claim that you didn’t do something or not that you aren’t responsible of something, to the key question of what evidence do you have? | Processes |
Repudiation threats mainly manifest themselves at business level, an attacker can target the logs, or repudiate an action.
4.4. Information Disclosure
| Threat | Violated Property | Definition | Typical Victims | Examples |
| Information Disclosure | Confidentiality | Providing information to someone not authorized to see it | Processes data stores, data flows |
4.5. Denial of Service
| Threat | Violated Property | Definition | Typical Victims | Examples |
| Denial of Service | Availability | Absorbing resources needed to provide service | Processes, data stores, data flows |
4.6. Elevation of Privilege
| Threat | Violated Property | Definition | Typical Victims | Examples |
| Elevation of Privilege | Authorization | Allowing someone to do something they’re not authorized to do | Processes |
5. STRIDE Variants
Stride is not a methodology, but a technique that gives some principle to perform threat modeling. The first variant is STRID-per-Element
5.1. STRIDE per element
This variation starts from the idea that some threats are more probable to materialize on some elements of the diagram. For each type of victim we can identify individually the threats that typically affect that victim.
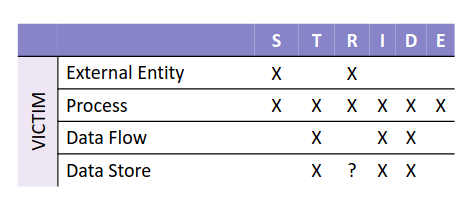
5.2. STRIDE per interaction
Instead of looking element by element, we look to the interactions of the system: source, destination and type, identifying the possible threats. The threats identified using this methodology can be different from those identified with the per element analysis. For this reasons the two could be combined to enlarge the analysis considering the single elements first and then their interaction.
In practice all the tables are derived from technical documentation, and documents already produced; at the exam some information are provided but assumptions should be made; the evaluation consider the consistency of the assumptions with the answers.
It is important to look from the inside of the system, not from the external.
5.3. DESIST
Desist focuses on the consequences of the threat, so the properties are reshaped, and tries to capture the fact that there are some interactions that are not correctly captured (Dispute replace Repudiation), and rephrase Denial of Service with Service Denial.
The essence is the same; it tries to categorize the problem and relate it to a given security property.
6. Check the Model
After the STRIDE elicitation is finished, we have to check if we have at least one threat of each type in STRIDE. The subsequent check is to see if there is at least one threat per element of the diagram; this check is in place to ensure that we didn’t forget anything (important in very large systems).
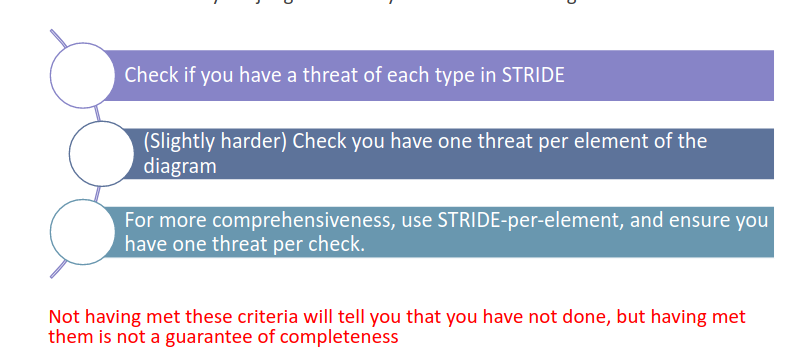
Those criteria are indications, even if all of them are satisfied they are not a guarantee of completeness, but just a way to avoid big mistakes.
6.1. Observation
When using STRIDE we are just enumerating possible problems, without performing any prioritization. It could be possible to record all possible attacks, even if there is a mitigation in place, in such a way to test the mitigation that are in place (or will be implemented). STRIDE is not a taxonomy, or a classification (partition) mechanism, but is a labeling method: some threats can match with more than one STRIDE Criteria; when reasoning with STRIDE it is not important to sync any potential issues in a single category.
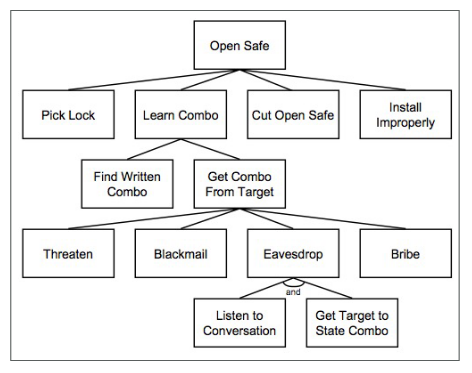
7. Attack Trees
They are easier to use during an attack centric analysis. An attack tree is a way to describe a system following a top down approach. Starting from a general view and functionalities of the system, then the functionalities are decomposed in a more specific way, considering all the issues that the system may face. An attack tree is also a way to represent the features of the system should guarantee, so it is useful also to build a global knowledge about the system and related threats.
At the same way attack trees can be used also for awareness purposes, and can be reused at each iteration of the analysis to describe all the countermeasures that could be applied all the new discovered issues. Finally it could also be used by the tactical and strategic level to take better informed decision.
Another relevant aspect concern the fact that the this model can be also used to identify mitigation because the use of a tree like structure enable the analyst to decompose a general problem more detailed implementation of it, guiding in the mitigation identification.
The root typically represent the main problem that we want to analyze, going down to the level of the tree the macro problem is decomposed in more detailed sub problems.
In a complex system there are several trees, each tree represent a different goal of the attacker, or to analyze a single problem from different point of views.
The focus is on the attack and not on the system itself, so it’s preferred in an attack centric approach.
There are different ways in which we can use attack tree to enumerate threats:
- Use existing attack trees and merge them over the system. Sometimes the six threats are defined by STRIDE and for each one an attack tree is implemented.
- Create your own attack tree, starting from the environment to find possible attacks. In this case is possible to start from a specific asset, and implement and attack tree for each threat that can harm the asset (from asset centric to attack centric)
- Create trees with the intent that can be shared with others: leverage over existing community information, creating some kind of shareable (general) attack trees.
In all of the above, consider that creating new trees is really difficult. If the domain is very specific create your own tree, but it will require time and effort, on the other hand if the domain is not very specific try to look first to already defined trees and then customize them.
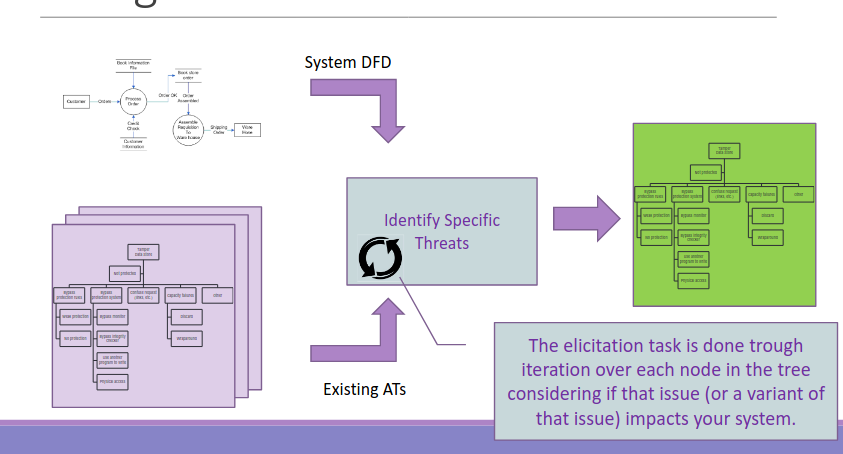
7.1. Using attack trees to find threats
Given a description of the system formalized in some way, and existing attack trees, then map the ATs over the system to filter what represent a real threat from the set of all possible candidates. Ideally this task could be done automatically, but there are no solutions that do that fully automatically. The attack Graphs are a tentative of automation, but they are not fully automatic.
The capability of the analyst is fundamental during the mapping phase.
7.2. Creating Attack Trees 🎄
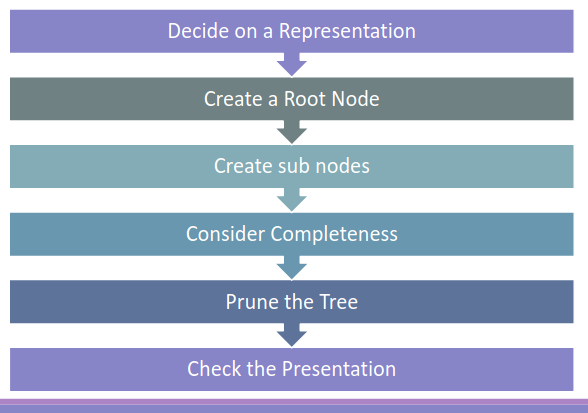
7.2.1. Decide on a Representation
We can use two approaches: AND Trees or OR Trees. In the first the existence of a node depends on all of the nodes belong it being true, it represent different steps in achieving a goal; the latter the existence of a node is true if any of its sub nodes are true, representing the same way to achieve the same goal.
Of course the two representation could be combined, but when implementing one or the other approach the way of reasoning change.
7.2.2. Create a Root Node
To define the root we need to define what is the target, so the purpose for defining the specific tree. The root can be represented by a component (i.e. a software component that represent the asset), the goal of the attacker (i.e. the action that the attacker will perform), or a general harmful condition of the system.
When creating the root it’s important to keep in mind the scope of the analysis, the suggestion is to use OR trees, and draw them into a grid that the eye can track linearly.
STRIDE keywords, or specific security requirements of the context can be used as root node.
7.2.3. Sub Nodes
At some point, nodes of the tree can be labeled, the labels can help during the mitigation and risk identification. Boolean value can be used to asses when that specific attacks are possible or not.
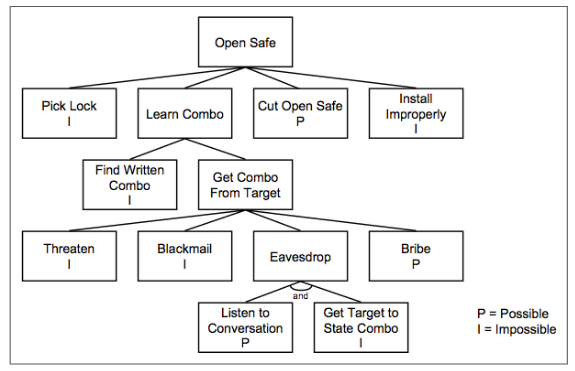
Other boolean values can be used, to classify an attack as easy/complex, expensive or cheap, intrusive, and non intrusive, if special equipment is requirement, and so on.
All of this information can be used to perform a better analysis when considering different threat sources, and attacks. For example via supporting the cost benefit analysis.
Continuous values could also be used, for example the cost of the attack, cost of defense, time to achieve the attack and more.
The countermeasures can also be contextualized in the tree to perform a what if analysis simulating what does it happens when a countermeasure is applied.
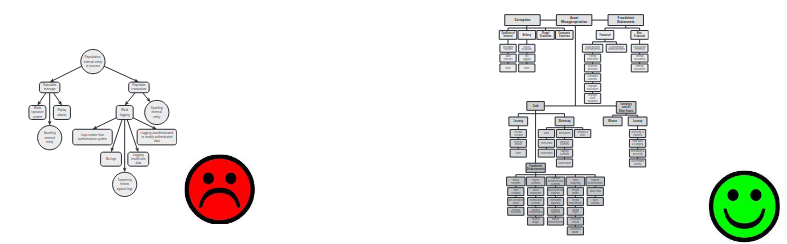
7.2.4. Human Viewable representations
Being a visual representation of a problem, the information represented must be drawn in such a way to be easily studied by an analyst. In general an attack tree should be compact, also the graphical representation must be information rich and communicative.
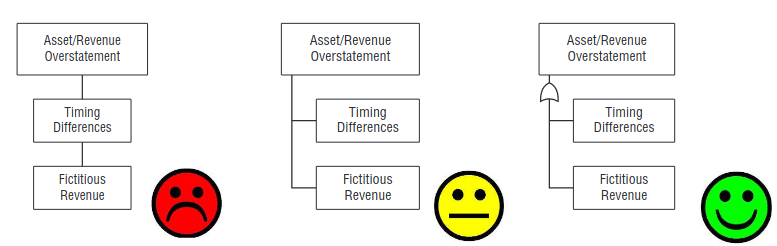
Another problem is due to the fact that diagrams may include a huge number of leaf. A compact representation is useful to make the tree fit in one page. So the position of the elements must be consistent.
8. Attack Libraries
Attack Libraries can be used to support the generation, or the labeling of the existing attack trees. They are formalization of knowledge, available to the community. They are created from different pursposes, and can be more general or more specifics.
8.1. MITRE CAPEC
MITRE CAPEC is a catalog of possible attack patterns, the information provided by CAPEC that are useful in a threat modeling phase are the severity, the description, the required knowledge and more. Those information are really useful when labeling the nodes of the tree.
Also in CAPEC attack patterns the steps of the attack are defined, helping in the modeling, extracting information and translate them in our application domain via an attack tree.
It requires a lot of human effort to be used, also people must be trained to use it properly, especially when different paths are merged.
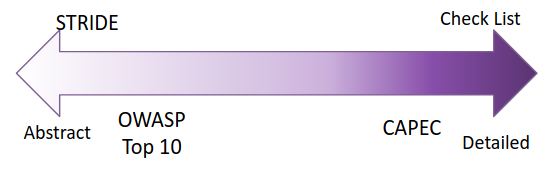
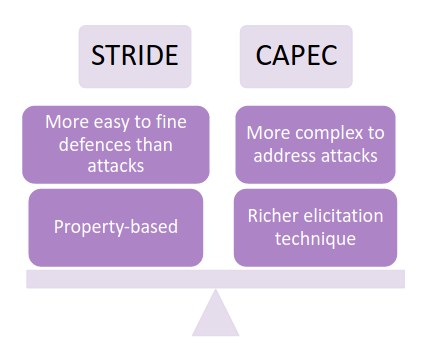
Comparing CAPEC and STRIDE there is no winning solution. It depends on the context and the solution to implement.
8.2. OWASP
The OWASP Top 10 Web Security Application risk, is a table that represents the set of most harmful, and critical security risks to web applications. The document is produced thanks to the collaborative effort of different actors over three and half years of analysis.
In the 2021 there are different problems that exists in practice. In particular the ranking can drive the identification of possible issues to face.
It also provides an explanation related to each specific issue related to the risk itself and the motivation behind it’s position in the leader board.
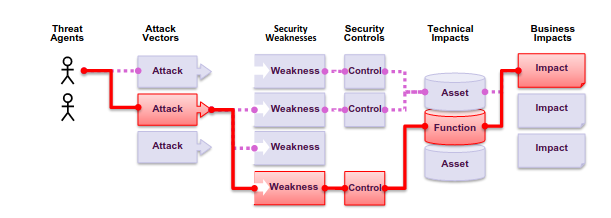
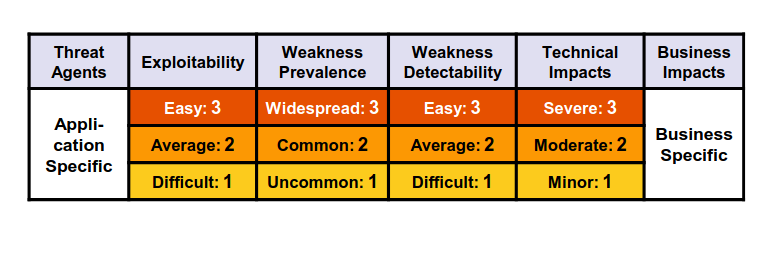
For every element in the top ten, considering a specific threat agent generic information about likelihood and technical impact using a typical scenario. Of course the business impact is not computed, but some insight is provided.
It also provide references to the NVD repository to linked vulnerabilities of each risk.
9. Attack Graph
The attack graph model is a generalization of the Attack Tree model, it enables the representation of different tasks of the cyber-risk management: the likelihood, low level representation, the impact, and also supports the awareness supporting the analyst giving him an overview of the whole system.
Generally speaking an attack graph is a general representation of all the possible ways that an attacker can use to intrude inside the target network. It works by
The interesting point is that it enables the analysis of different attack paths, enlarging the view on the whole network.
In a typical attack graph, nodes in the graph represent hosts (or privilege that may acquire on a given host) and the edges represent the software vulnerability exploits employed by the attacker.
It gives an overview of all the potential problems that the attacker can exploit from a given host, and what he can do from there.
The fist critical problem is studying the reachability conditions inside the network. The topology tells the physical connections between the hosts. The problem that having a direct connection does not mean that two hosts have a direct connection: it depends on routing tables, firewall rules, and segmentation. Also in the network tools such that IDS are present, and can be used to block the communication between different subnets.
An over estimation of the communication may bias the analysis, so the constraint that exists in the practical environment must be taken into account to represent the reachability conditions. In this way is possible to identify the edges of the network.
This model is flexible and powerful, however those capabilities leads to several problems, mainly related to the scale of the system (this approach may generate an huge amount of paths), so we have to find an effective method to perform an complete analysis in a reasonable amount of time.
9.1. Example
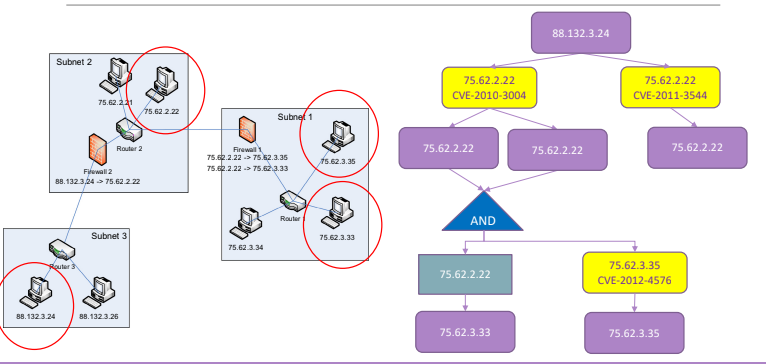
This image represents an example of three interconnected subnetworks, and the related attack graph. It represent the vulnerability between two hosts using a vulnerability node.
9.2. Format
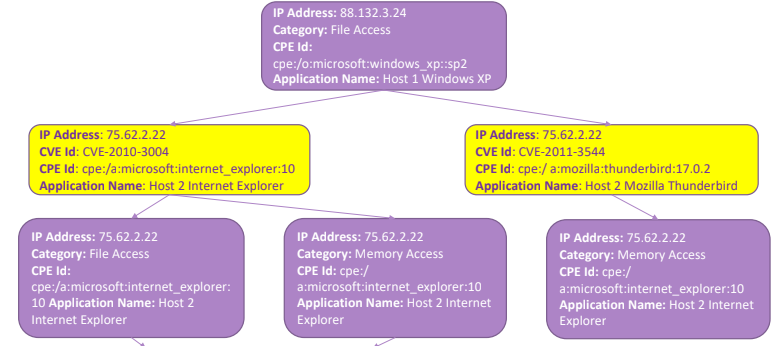
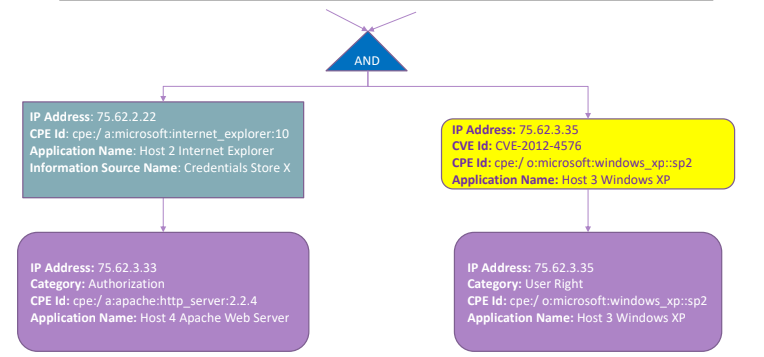
The purple block (in the example) is the privilege node, it indicates the level of privilege that the attacker may have over the host. For example user privileges or write/read/execute permission over a given files.
The yellow node represent a vulnerability to exploit that can be applied on a given software. The light blue node indicates information sources that can be applied by an attacker, and can represent a starting point for another analysis, or represent specific conditions over a specific node. The conjunction nodes are not considered by all the algorithm because they are complicated to be implemented, they represent the combination of different privileges required by an attacker.
All nodes (except conjunction node) contains the following information: IP Address, CPE Id, Application Name, in addition there can be specific fields for given blocks:
- In privilege nodes the category
- In Vulnerability nodes there is a CVE Id
- In information source usage node there is an Information source name.
From the point of view of an human analyst it is not difficult but it is time consuming, from the point of view of an automation it is quite a bit complex, because some information are not easy to encode: preconditions and post-conditions are difficult to retrieve and contextualize automatically.
9.3. Basic Problems in an Attack Graph generation
Generally speaking, looking at the whole process there are four main problems that need to be solve before using this approach:
- Reachability Analysis. It is difficult to start from the input and designing the reachability graph because there is no de-facto standard technique to build it. Starting from all the routing tables and firewall rules the analyst (or an automatic tool) will came up with the reachability analysis.
- Determination of the attack template. It is basically the definition of the information that the analyst will include inside the attack graph. More information will require more time, and lead to more accurate results.
- Attack graph structure determination. In this phase the analyst decide the format of the attack graph. There are different possible representation. The fact that there are different possible representation is one of the problems of this approach. There is no a fixed structure to use.
- Attack graph core building mechanism. The last problem is represented by the construction of the algorithm that analyze the graph.
9.3.1. Reachability Analysis.
It starts from information related to the communication network, translating them into a structure that can be used in order to attach the vulnerabilities, analyzing only the real possible ways of interaction between hosts.
Particular edges can be label to the condition of reachability and paths. This step can be represented via reachability matrix or reachability graph. For the sake of space the matrix is used:
- The matrix measures NxN, where N is the number of hosts on the network
- In the interception there is the reachability condition
- Of course given that in most of practical communication networks the condition is not symmetric, a reachability condition for each end point is needed.
Different information can be put inside the matrix. Simply flag with a boolean the communication is possible, or more useful information can be used like which port, which protocol, or specific connection / application. All the vulnerabilities not affecting the specific port and protocol will be filtered.
The practical problem is represented by the fact that the information can be easily collected, but it is difficult to interpret them automatically: there may be problem given by NAT, private and public hosts, differences between firewall configurations and more. Of course more information you are able to include, more refined the analysis will be.
9.3.2. Attack Template determination
Defining the attack template, we have to specify which are the conditions required by the attacker to exploit the vulnerability. So it represents the pre-condition and post-conditions of the exploits, most of the common attack graph representation represent both kinds of condition as privileges that the attacker needs/acquire. A manual approach is easy but time consuming, an automatic approach on the other hand is much more difficult: a lot of the information are written in natural language.
The analyst can reason in terms of access on the machine (guest, user, root), rarely it can be useful to reason in term of privileges on a single application/file.
9.3.3. Attack graph structure
This point deals with the semantic of nodes and edges, most of the approaches uses the semantic of:
- Privilege node
- Edges associated to the vulnerabilities
But there are few exceptions.
9.3.4. Attack Core building mechanism
In this case ideally the analyst would have a complete attack graph generation (Multi Source, Multi Path attack graph), the implementation of this algorithm is of course NP-Hard. For this reason alternatives are needed: optimization and heuristics algorithms that will compute the most complete view for a given analysis.
9.4. Issues
The main issue of attack graphs is the Scalability. To deal with it there are some countermeasures:
- Monotonicity assumption. Consider only the higher level of privilege acquired.
- pruning. Start building the graph, but an optimization function is evaluated at every step that prune a branch of the graph, leaving only the branch with the highest likelihood given some parameters.
- It is possible to reason in terms of shortest paths, fewer steps are more dangerous that long paths.
- Cycle-free attack graph.
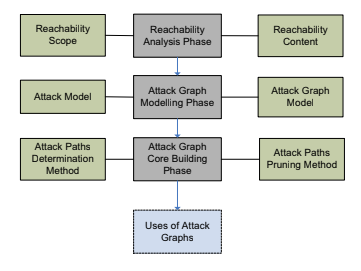
9.5. Taxonomy
We can classify the generation of the attack graph into three high-level phases. In which the first point to take into account is related to reachability, that is composed by the definition of the scope, and it’s content. The second phase is the definition of the model composed by the model itself and the template. Once the content of the graph is ready the core building mechanism phase can be done: the strategy is defined here together with the pruning method.
Finally there may be different usages of the attack graph.
9.5.1. Reachability analysis phase
The reachability analysis phase mainly investigates the network reachability conditions within the target network. There exists two main criteria:
- Reachability Scope. In deals with in the scope of the hosts among the reachability conditions.
- Reachability Content. Express what you are considering in the intersection of the host.
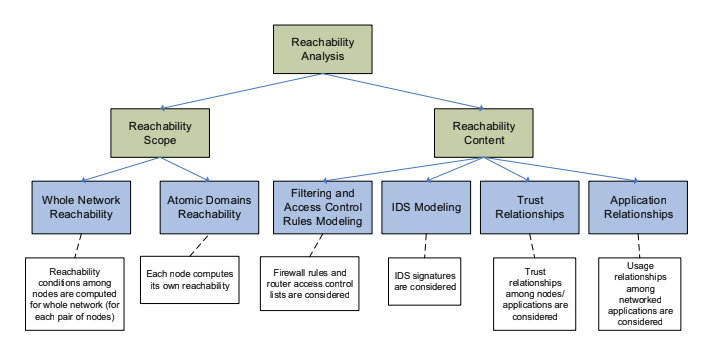
9.5.1.1. Reachability Scope
The Whole Network reachability is a possible approach (includes all the hosts inside in the network), when the second type deals with application domain. Instead of looking to the whole system together the analyst consider first the reachability condition inside a sub-set of the domain and then relate different domains.
9.5.1.2. Reachability Content
The information needed can be gathered from Filtering and ACL rules, so firewall rules, routing tables and ACL Policies, another source can be IDS Modeling in which the signatures are considered; Trough relationships, that can be present among nodes and applications (for example the nodes in the inner part of the network, that are supposed to be not accessible for anybody and un-trust the exposed public hosts); last example of information that can be included deals with the application relationships, so the usage relationships among networked applications.
This alternatives may be combined together, to increase the level of granularity.
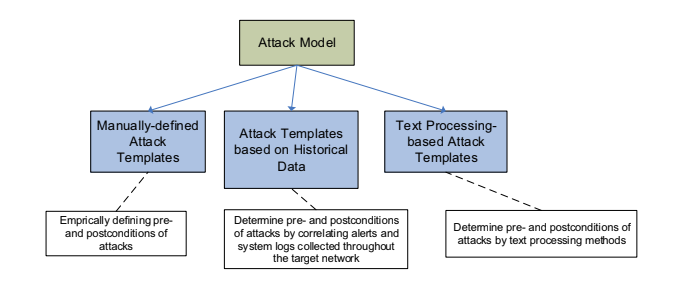
9.5.2. Modeling Phase
There exists three main approaches, they deal with the definition of the semantic and the content of the blocks. The first one manually define the content of every node, so the basic types of pre/post-condition are extracted and are used to define the model (bottom up approach).
A second approach is based on Historical data. Defining pre/post-conditions is done by looking at what happened in the past and at the type of correlation. This kind of approach could be interesting, but it requires a good quantity of available data, and it can’t be represented just by few reports, but by statistically relevant data. It is interesting if the model can leverage from information sharing communities, in order to extract conditions of specific types of attacks and exploits.
The third approach is using text mining and processing to define pre/post-conditions from the text provided by the NVD Database; and even if the level of privileges is not told explicitly, the unchanged field may give useful information. There are different approaches that implements this technique, one example is a keyword based approach, more complex implementations can be represented by NPL implementations. Most of the time the post-conditions are difficult to retrieve, so most of the time people use the scope field of the NVD Database.
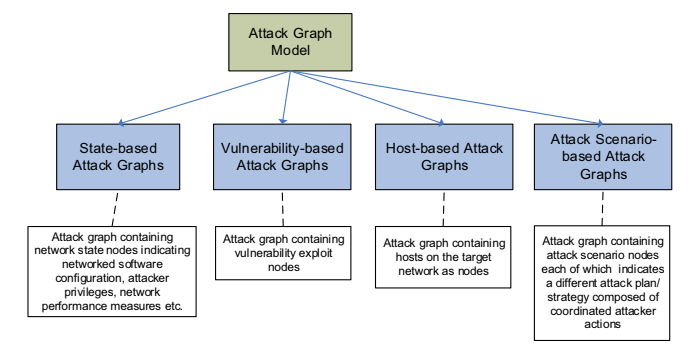
When considering the semantic of nodes and edges there are four main categories.
- State based attack graph, in which every node represent a given state of the system. Modeling it as the configuration needed for the exploit or the privilege needed for it, or the capabilities. It was the first introduced, proposed more than 20 years ago; today this approach is not feasible anymore, given the number of hosts, and the number of vulnerabilities.
- Vulnerability based attack graph, puts in the center of the analysis the vulnerabilities, highlighting them linking the hosts that could be impacted.
- Host based attack graphs. The two perspective are merged, trying to understand how to move inside the network from host to host. The link between hosts is the vulnerability, and the attacker is an agent that explore the graphs, that is constructed starting from the information available.
- Attack scenario based. In this case the attack graph is the combination of all the possible attack paths given a starting point, reachability condition and a set of vulnerabilities.
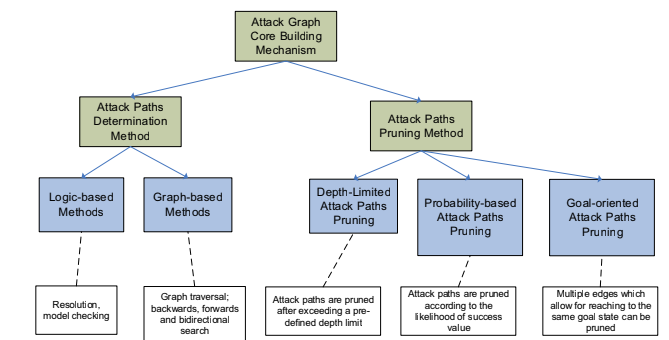
9.5.3. Core Building
We need to consider how to compute the graph, and how to prune it. In the first case there are two families of algorithms:
- Logic based. They encode the correlation rules as logical rules, the most famous one encodes relation rules in data log, the graph is computed by giving the knowledge base to a reason that will infer the state.
- Graph based approach we are leveraging on algorithms that are based on graph theory, for example spanning trees, constructing the graph by visiting all the nodes, until we get to a termination condition.
Most of the time even if from the topological point of view they are different the information stored is equivalent, so the purpose of the application lead the decision. Graph based method are better suited for analysis purposes.
Concerning the pruning methods we have three alternatives, that can be applied together, the first one is a depth limited attack path prune (explore up to certain depth), of course this approach can lead to incomplete results, good for monitoring purposes but not for risk analysis.
The second method uses probabilities, so the path extended are only those with an high likelihood. It works by applying a local optimization function over the nodes.
The third method is a goal based approach, so it extend the graph using an optimization function over a goal (if the goal is the likelihood it is the same of the second), but the goal value can be anything.
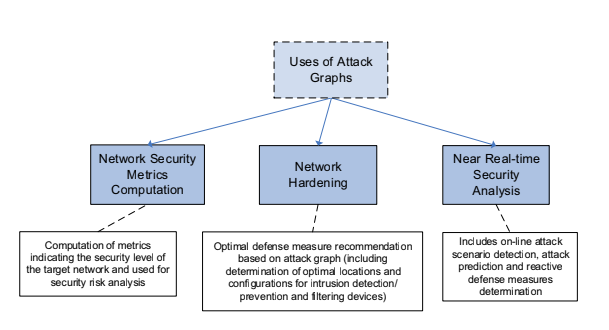
9.5.4. Usage
The usage of an attack graph can impact different aspects, for example can be used to compute network security metrics, or to support decision over network hardening, to prioritize which are the vulnerabilities to patch, and also to perform near real-time security analysis. It can be done via mapping the hosts that are part of a specific attack path to monitor the execution of specific actions.
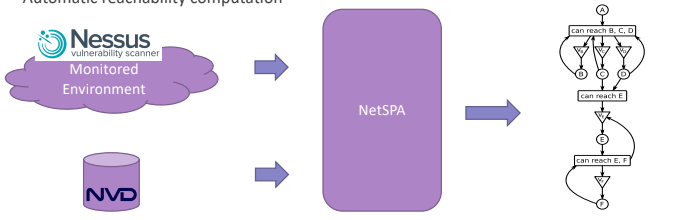
10. NetSPA
It is one of the algorithm that may be used to generate an attack graph. It has been proposed several years ago, and the idea behind it is rather simple, the data used are not machine friendly, some of them could be extracted automatically, where others are quite challenging to extract.
The algorithm abstract the idea that behind an exploit may there be many different preconditions, so instead of getting crazy to interpret all the possible combination, they used a Prerequisite node in the graph. Apart this, the concept of attack graph remains unchanged. It can be interconnected with existing monitoring systems, in particular with Nessus and the NVD Database. This solution provide also suggestions and an algorithm to compute the reachability matrix.
In this philosophy a vulnerability is not only a CVE but anything that represent a weak point.
The diagram shows the main concepts of the NetSPA data models, the first thing to do is to define the format of the data. There are six main concepts:
- Access Level
- Host. It is one of the node considered. Every host will have some access level, so it can be accessed from different users with different rights. So NetSPA consider this link with the Access Level concept. An Host running in isolation can be excluded.
- Interface. It is linked also to the Open ports.
- Rules. It is a particular attribute related with the relationship host and interface, given an interface over a host there may be multiple rules that specify how the hosts uses that interface.
- Open Port. Are used to filter out vulnerabilities.
- Vulnerability. From the point of view of the algorithm we are interested only on those that are exposed over open ports.
Trough combination of Host and Access Level NEtSPA represent the attacker state, and they model the existence of some credentials that allow to link together vulnerabilities and attacker.
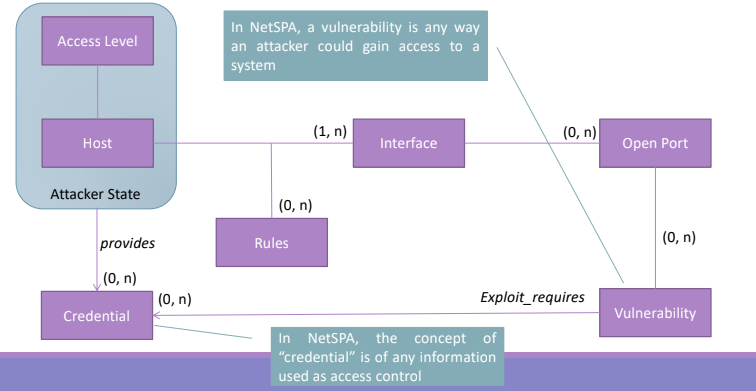
The model is flexible enough to include any kind of vulnerability, so it can be extended. The credential is anything that represent a way to access a resource (any auth and id mechanism may be abstracted like a credential)
10.1. Multi Prerequisite Graph
The output of the algorithm is a graph composed by three kind of nodes:
- State nodes. represent an attacker’s level of access on aa particular host. user at host 1, root at host 2. From the state nodes there are outgoing edges that goes to a prerequisite node.
- Prerequisite node. It express the condition needed to perform an exploit given the state in which the attacker is. They have an outgoing edge to a vulnerability instance.
- Vulnerability node. It is an instance of a specific vulnerability over a specific port.
10.2. Algorithm
The basic idea is that given a root node, the graph is computed by adopting a breadth first technique that navigate over the graph.
The complexity of the code is high given the fact that the prerequisites are not easy to obtain. Also the information obtained from scanners takes a perspective that is completely different from the one used by an attack graph generation. Not all the vulnerabilities are really present on the host, because the probing mechanisms is a best guess approach a whole set of vulnerabilities can be obtained, so the attack graph will use a super-set of existing vulnerabilities. so false-positives could be included in to the analysis.