Code Packing - Lab
Table of Contents
1. Lab
- Class: Malware Analysis and Incident Forencsis
- Topic: Code Packing
2. Sample 01
2.1. What useful infomation can We get from static analysis?
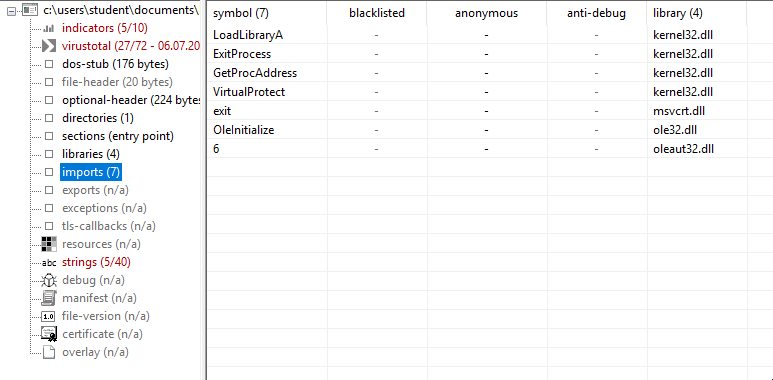
2.1.1. Sections and Imports
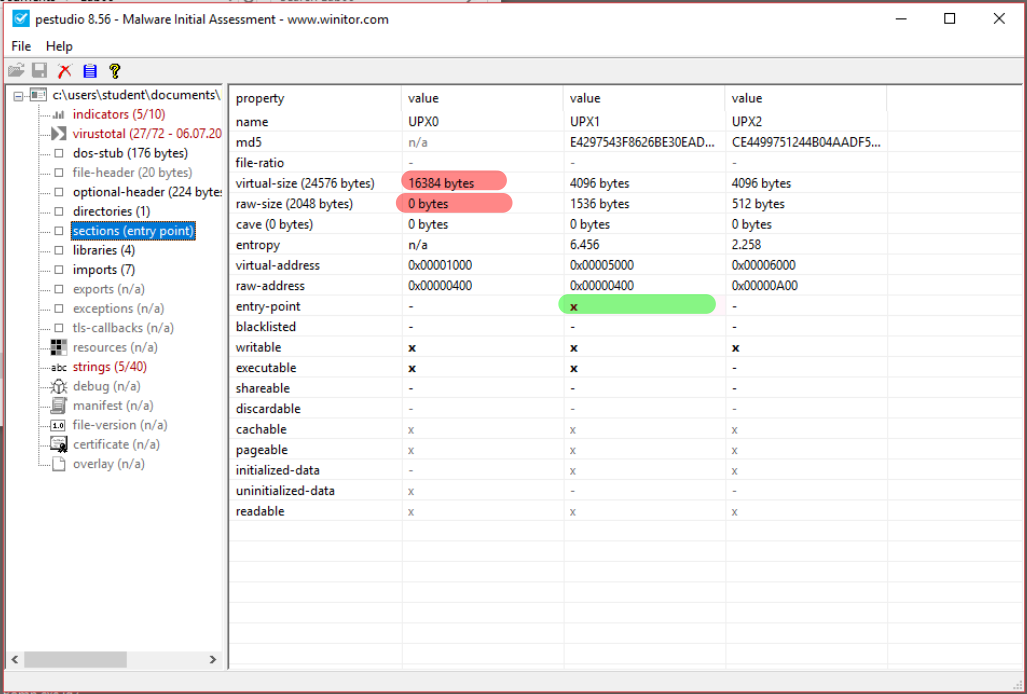
The sample has three sections: UPX0, UPX1 and UPX2, looking for imports the PE imports functions from four libraries: Kernel32, msvcrt, ole32 and oleaut32. The most relevant functions that are imported are: LoadLibrary, GetProcAddress, and Virtual Protect.
Another evidence of packing is represented by the fact that the section UPX0 as a raw-size of 0 bytes but a virtual size of 16384 bytes. Another thing is that the entry point of the program is in section UPX1:
2.1.2. Possible IAt recontruction strategy
Given the presence of one function import for library we can assume that the strategy used by the packer is the strategy number three.
2.1.3. Entropy
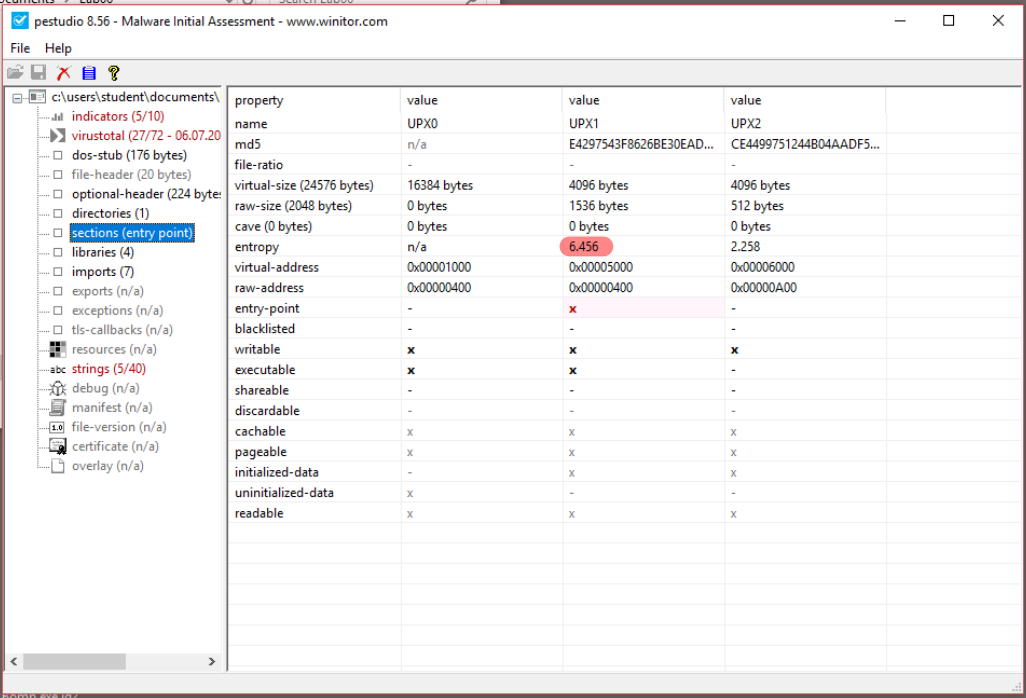
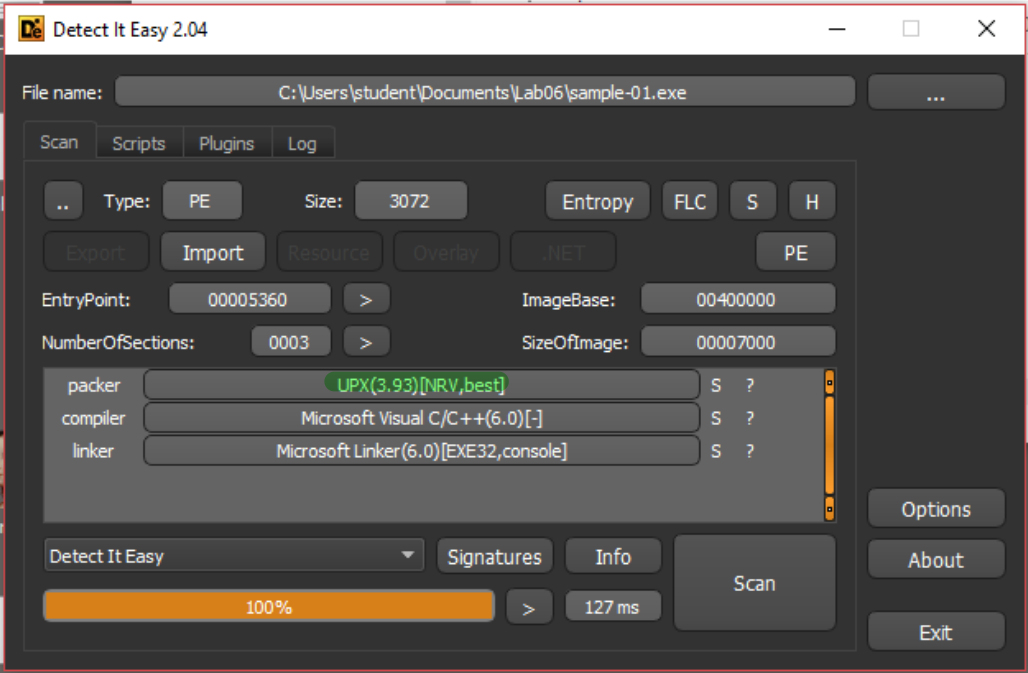
We can inspect the Entropy of the different sections using PEStudio, and Detect it Easy. In PEStudio the entropy is shown in the sections category:
Detect it Easy indentifies the UPX packer, and in the entropy section is shows the entropy graph and also the entropy value of each section:
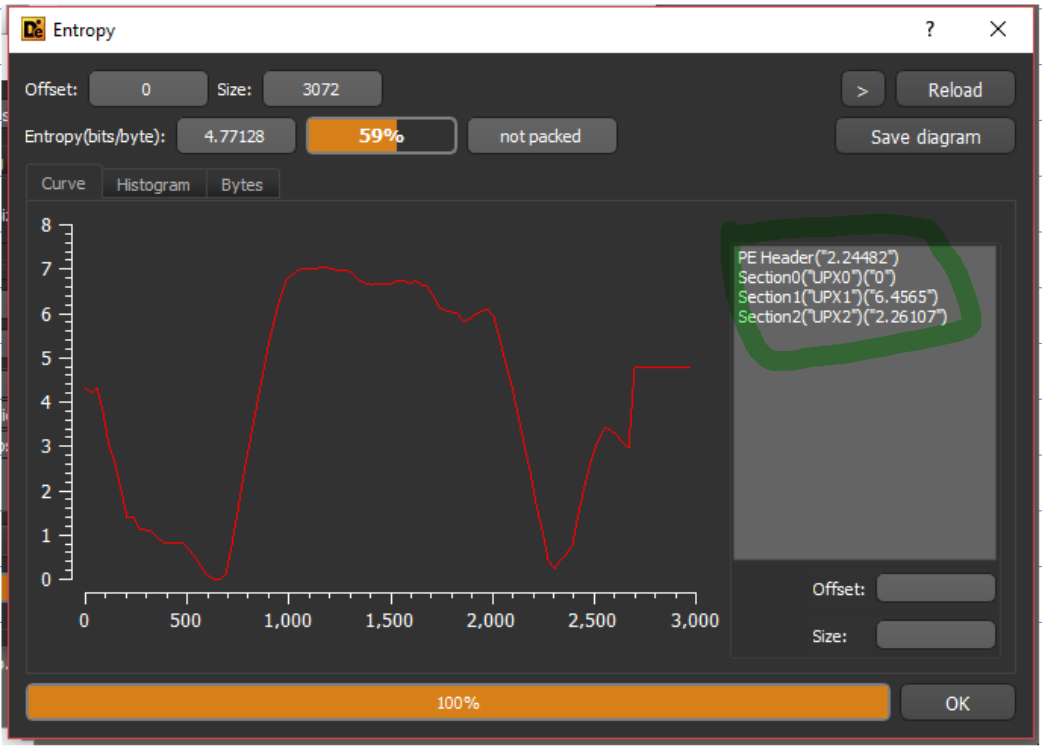
In this case the entropy analysis gives some hints but is not high enough to be used as only evidence of packing.
2.1.4. Strings
Also in strings it’s possible to see the function names LoadLibrary and GetProcAddress.
2.2. Code Analysis
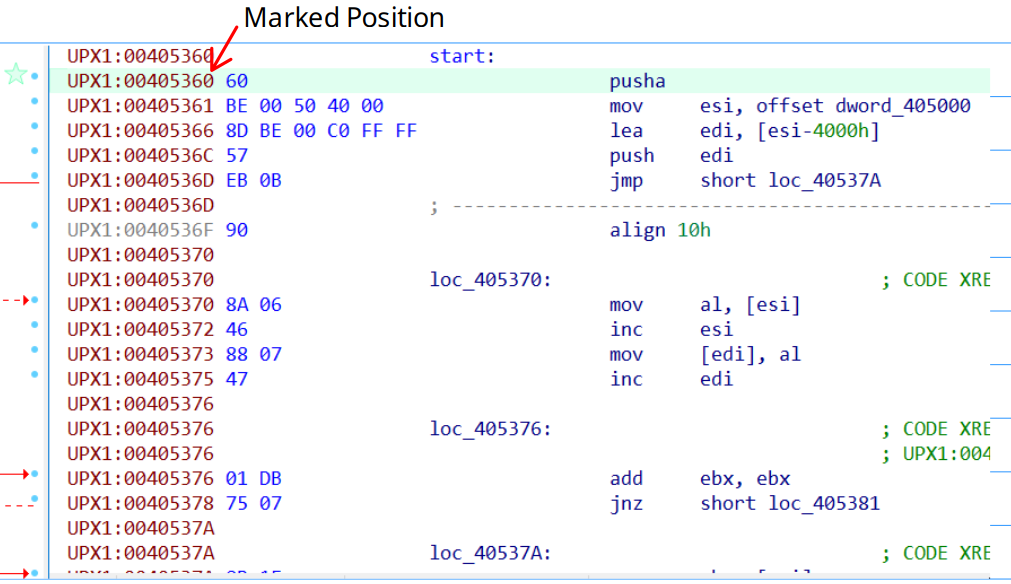
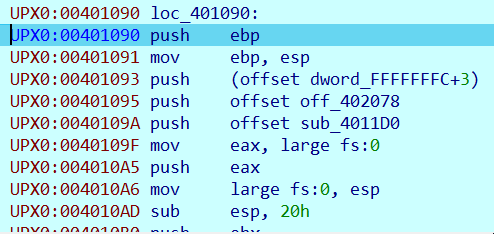
When we open the sample in IDA, it identify the start point at 00405360 in section UPX1.
2.2.1. Locating the Tail Jump. (1)
We have to locate the Tail Jump. There are different strategies to do that, the first one is to look for an huge jumps of which the destination is in another section and points to garbage.
To identify a jump like that we can use the GUI and follow the arrows, or We can go the chad way showing the opcodes and using the value of the jump as reference. Another tip is to mark the positions of interest with Alt-M, and recover those marked positions with Ctrl-M
We’ll find two interesting inconditional jumps, the first at 00405425 and the latter at 004054EC. The first inconditional jump, jumps to an address that’s inside UPX1 containg code. The second inconditional jump jumps to 00401090, that’s in section UPX0, and contains just garbage.
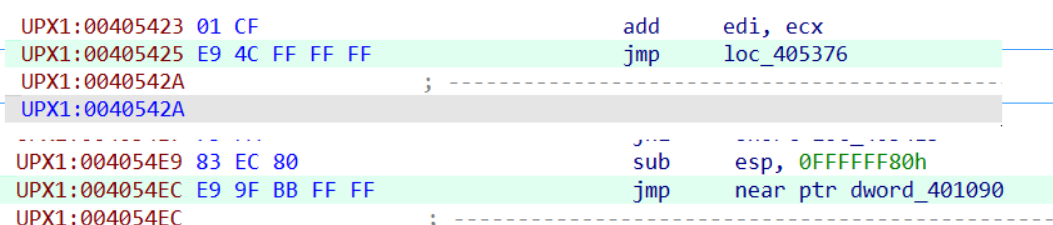
The last inconditional jumps seems the right one, to check the hypothesis put a breakpoint there and then step over it, and check the content of the destination address.
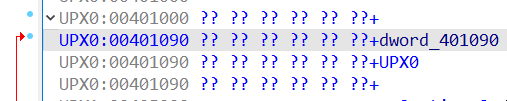
When debugging the sample the picture changes drastically:
We can infer that 00401090 is the OEP address.
2.2.2. Locating the Tail Jump (2)
Another technqiue that can be used to locate the tail jump is to look for a popa. As we can see in the code the first intruction is a pusha:
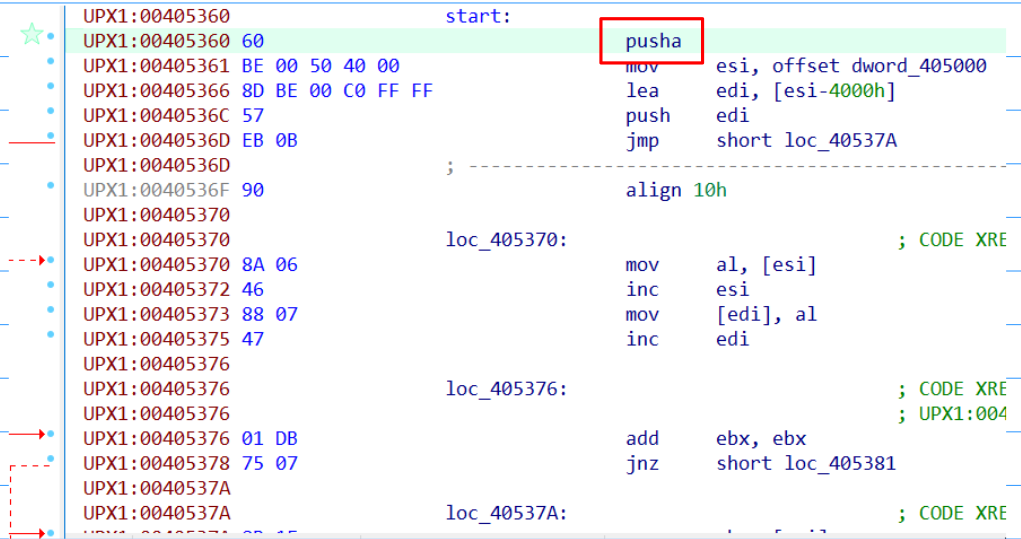
The pusha instruction pushes all the registers into the stack, so we can use a memory breakpoint to check when the first position of the stack accesed by pusha is accessed again.
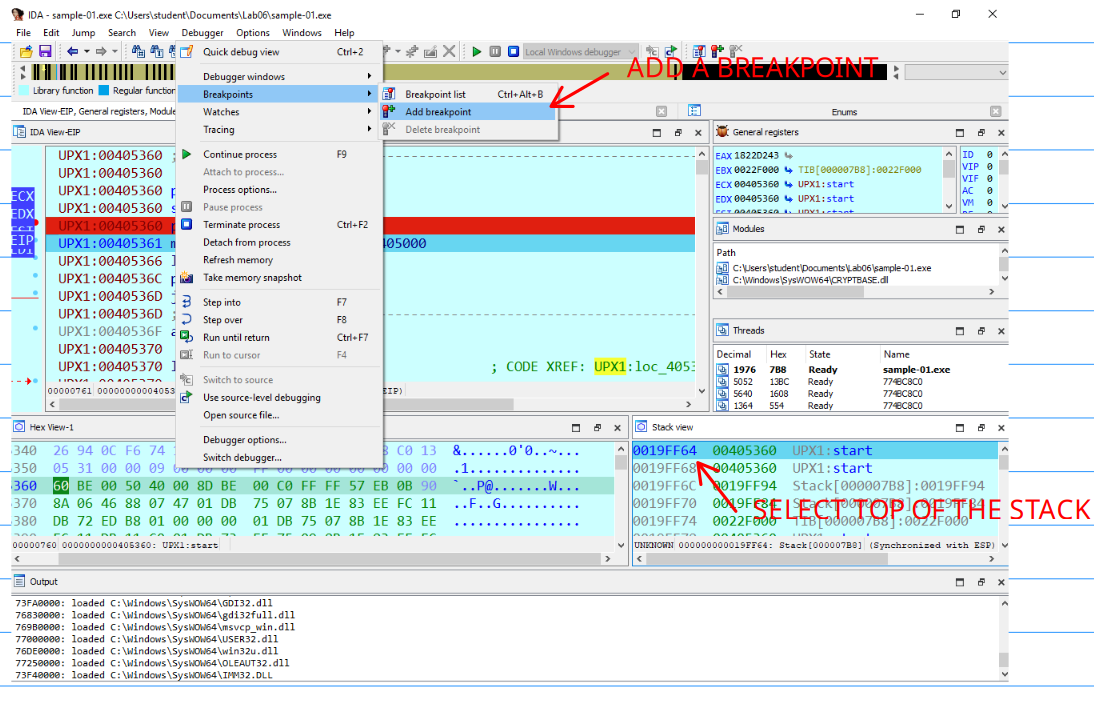
And select hardware, and read/write mode:
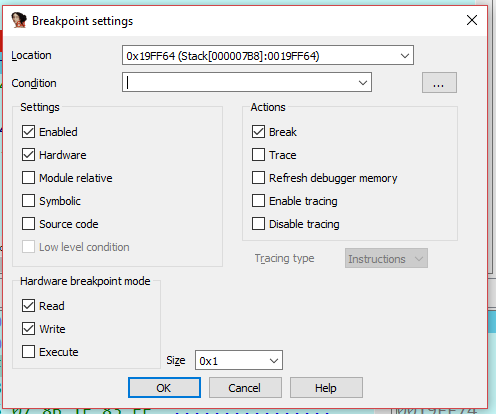
When resuming the execution the breakpoint triggers just after the popa instruction that is just few bytes away from the tail jump.
2.2.3. Fixes, Fixes everywhere
Now let’s use Scylla to dump and then fix the PE to obtain it’s unpacked version. With the debugger running fire up Scylla and attach it to the running sample. In the OEP section specify the probable OEP address, and the We instruct the software to perform an IAT autosearch and to Get Imports.
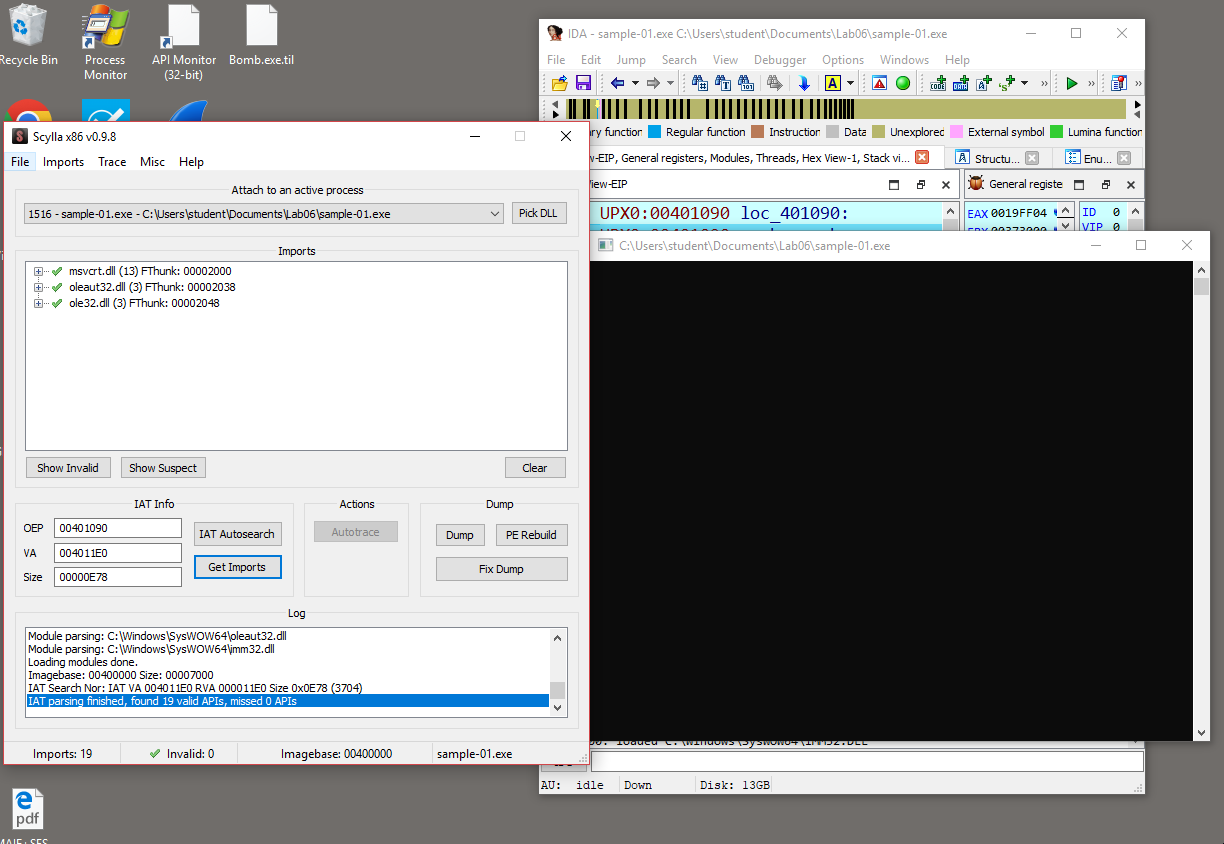
If everything goes well, and no fixes are required it’s possible to Dump, and Fix the Dump. First we dump the PE an save the dump in a specific folder; the we select the saved dump to fix it. The result is an unpacked version of the sample.
2.3. Additions
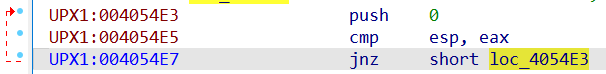
There are some interesting aspects of the code. The first one is related with the functioning of the packer used (upx), in fact right before the tail jump there is a small loop that has the pupose of cleaning the stack:
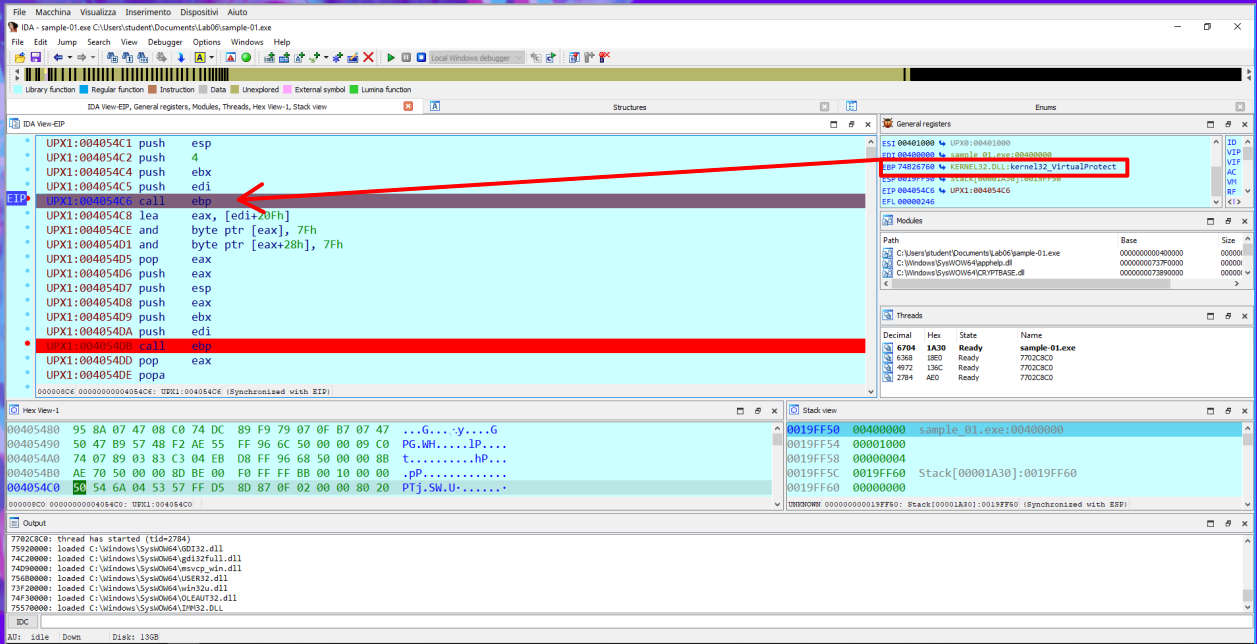
A slightly more complex thing to see is the fact that the packer, during the umpacking phase it uses the function VirtualProtect twice. Once to add write permission to section UPX0, and then again to remove the permission.
3. Sample 02
3.1. Static Analysis
3.1.1. Packer used
Inspecting the sample with Detect it easy. it identify FSG as the packer used to pack the executable.
3.1.2. Imports
Using PEStudio We can see that the only library imported is Kernel32, and the functions imported are LoadLibrary and GetProcAddress. So in this case we are dealing with a packer that uses the Strategy One.
3.2. Dynamic Analysis
The technique used to find the Tail Jump is similar to the one used for locating the tail jump in the sample01. We just need to look for a huge jump, in this example the jump is conditional, to locate correctly the OEP We can try to use Instruction Tracing, seeing that the tail jump goes from seg001 to seg000 it’s possible to set up an instruction tracing in the following way:
then put a breakpoint on the code and start the debugger, then start the instruction tracing. This tecnique is very slow, so for this reason must not be abused. In this case the instruction tracing will end at 00401090.
3.3. Scylla
The dump phase is equal of the one of the sample01.